
Case studies investigated with SAMA


Sacramento-California and New Bern-North Carolina
[edit | edit source]For the full paper see: A Free and open-source microgrid optimization tool: SAMA the Solar Alone Multi-Objective Advisor
The results generated by the SAMA software are cross-verified with those obtained from Homer Pro, a well-established and widely recognized tool in this domain. This comparison was conducted across two distinct geographical locations with different climate conditions, namely Sacramento California located in Marine Westcoast climate zone and New Bern North Carolina in the Humid Continental climate zone of U.S. SAMA output plots are illustrated in Figures 1 to 14 for Sacramento-California and New Bern-North Carolina. Fig. 1 and Fig. 2 demonstrate the cash flow of the off-grid PV-DG-battery projects during their lifetimes (25 years) showing replacement times and costs, maintenance costs fuel costs and salvage value with revenues at top and costs at the down. These values are discounted over the lifetime of the project. The cash flow chart for both cities shows correct replacement of batteries and DG in the system, where batteries are replaced in 8th, 16th and 23th year, while DG is replaced in 14th year. Comparing cash flow charts of both Sacramento case study and New Bern yields the fact that off-grid hybrid energy systems will cost more in New Bern compared to Sacramento. This is mostly due to the difference in geographies and climates of these cities. As shown with the total cost lines in both cities under current economics, maintaining a grid connection is clearly a more economic option.
-
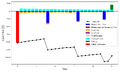 Fig.1.Project cash flow-Sacramento
 -
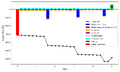 Fig.2. Project cash flow -New Bern


Energy distributions of systems for both cities are plotted in Fig. 3 and Fig. 4. In both cases, PV modules from April to October will generate more power due to high level of irradiance. Irradiance levels are higher in Sacramento; hence PV output is higher compared to New Bern. In the times PV output is higher, for example, April to July, DG is operating less. Also, battery power is higher from June to October and lower during winter. The reason behind that is a higher solar irradiation level during summer compared to winter contributing higher PV output in summer and storing this energy in batteries. Fig. 5 and Fig. 6 show the behavior of the battery in system with a high level of charge during summer (due to higher irradiation and PV power output) and lower levels of charge during winter.
-
 Fig.3. Energy Distribution-Sacramento
 -
 Fig.4. Energy Distribution-New Bern
 -
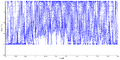 Fig.5. Battery SoC-Sacramento
 -
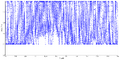 Fig.6.Battery SoC-New Bern


SAMA also plots the daily, monthly and yearly average cost of energy system, shown in Fig.7 and Fig. 8. For the purpose of grid-defection evaluations and researches, it is possible to use SAMA to compare relying only on the grid with the option of disconnect fully from the grid. Fig. 9 and Fig. 10 can thus be compared with Fig. 7 and Fig. 8. These figures provide useful insights into the daily, monthly and yearly costs of only relying on the grid (Fig.9 and Fig. 10) and under investigation energy system (Fig.7 and Fig. 8). Care should be taken, however, in comparing the heat maps across different situations as the scale is set for each individually. Monthly and yearly values can be compared numerically with the values on the right of each Figure. Overall, the results found that relying only on the grid in Sacramento will cost $1,623 annually while the off-grid PV-DG-BT system will cost around two times more ($3,133). As a result, SAMA’s user can figure out that grid defection is not economically possible in Sacramento. Similarly, grid defection is not economically feasible in New Bern where an off-grid system will cost more than $4,700 yearly in comparison with annual grid cost of $1,656.60. The reason why off-grid solar hybrid energy system costs more in New Bern compared to Sacramento is that Sacramento is exhibiting higher solar irradiation, hence, smaller PV system for this city will be needed.
-
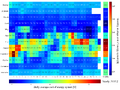 Fig.7. Daily average cost of hybrid energy system-Sacramento
 -
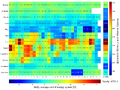 Fig.8.Daily average cost of hybrid energy system-New Bern
 -
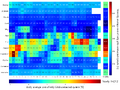 Fig.9. Daily average cost of only grid connected system-Sacramento
 -
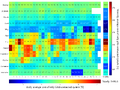 Fig.10. Daily average cost of only grid connected system-New Bern


On the other hand, if the hybrid energy system is connected to grid where electricity shortage can be bought and excess electricity can be sold, PV energy system will be more profitable in both cases. The results for grid connected energy system by SAMA are plotted in Fig. 11 and Fig. 12. Another SAMA’s output for grid analyses is illustrated in Fig.13 for Sacramento and Fig.14 for New Bern, representing the hourly cost of connecting to the grid. These figures are mainly dependent on the electricity utility structure of these cities and users can see the trend of grid electricity prices throughout the year.
-
 Fig.11. Daily average cost of grid connected energy system-Sacramento
 -
 Fig.12. Daily average cost of grid connected energy system-New Bern
 -
 Fig.13. Grid hourly cost per kWh heat map-Sacramento
 -
 Fig.14. Grid hourly cost per kWh heat map-New Bern


Kauai-Hawaii
[edit | edit source]One of SAMA goals is to help users find the least costly electricity. Locations that exhibit high irradiation levels and expensive utility rates may favor grid defection and thus unlike the two previous case studies an off-grid system could be economically advantageous. As a case study for this purpose, Kauai in Hawaii is chosen where utility rates are expensive and the energy mix is made up of substantial fossil fuels.
The results of the SAMA simulations presented Table 1 shows that grid defection in Kauai at the current time is economically feasible. Using an optimum hybrid off-grid system as suggested by SAMA is shown in Table 1. It is clearly economic compared to being on the electric grid in Kauai. The main reason behind this is the expensive utility rates. Fig. 15 demonstrates the cash flow chart of the off-grid system at this location pointing out the profitability of project. As the total cost (cost+revenues) crosses the $0 line after 19 years, it shifts from costing money to saving money for grid defection. Fig. 16 and Fig. 17 are also provided by for comparison of off-grid system to the properties connected only to the grid as a function of day, month and year.
-
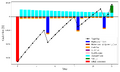 Fig.15. Project cash flow for grid defection case study- Kauai-Hawaii
 -
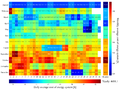 Fig.16. Daily, monthly and yearly cost of off-grid system for grid defection case study- Kauai-Hawaii
 -
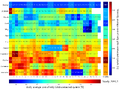 Fig.17. Daily, monthly and yearly cost of only-grid system for grid defection case study- Kauai-Hawaii


| Optimum size of system | NPC
[$] |
LCOE
[$/kWh] |
LCOE
for only grid connected system [$/kWh] |
NPC for
only grid connected system [$] |
Total avoided costs
[$] |
Initial cost
[$] |
Total operation and maintenance cost
[$] | |||
| PV
[kW] |
DG
[kW] |
BT
[kWh] |
Conv
[kW] | |||||||
| 12.08 | 2.55 | 29 | 3.53 | 89042 | 0.33 | 0.36 | 97830 | 97735 | 32767 | 16710 |
How to Use SAMA
[edit | edit source]
See Also
[edit source]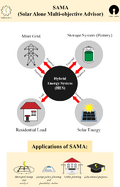

- A Review of Phase-Change Material-Based Thermal Batteries for Sustainable Energy Storage of Solar Photovoltaic Systems Coupled to Heat Pumps in the Building Sector
- Decarbonization of Residential Houses in Northern Climates: Traditional vs Fully Electrified Approaches in Ontario Canada
| Authors | |
|---|---|
| License | CC-BY-SA-4.0 |
| Cite as | Seyyed Ali Sadat (2023–2025). "Case studies investigated with SAMA". Appropedia. Retrieved August 1, 2026. |