
OSSTIP/WPBZE1
WPBZE1- Phase 1 Display of new BZE Network in OSSTIP
This is a Work Package as part of the OSSTIP project.
Inputs: BZE's Proposed updated network and frequency information, Working OSSTIP platform for display of existing PT timetable (OSSTIP/WP4), Network->timetable conversion tools (OSSTIP/WP5).
Outputs: Installed instance of OSSTIP with relevant GIS data uploaded, Created map-based analysis, and updated documentation.
Estimated Time: Small-Medium
Requirements Summary
[edit | edit source]In this Work Package, the previous work to set up a display and analysis capability for Melbourne's current public transport network in OSSTIP/WP4 will be applied to the first version of the new proposed public transport network and preliminary timetable that BZE have developed.
Note: whilst this work package is going on, we expect considerable effort will be needed to refine the proposed network into a full GTFS-compatible timetable, even with the supporting tools developed in OSSTIP/WP5. This will primarily be the responsibility of BZE team members, although User:PatSunter will support this process throughout this work package.
Results
[edit | edit source]Creating the BZE GTFS files
[edit | edit source]Using the process developed in OSSTIP/WP5, by December 2013 we were able to create a GTFS schedule file for BZE's proposed modified bus network, running on a high-frequency timetable, as follows:
| Time Period | Service Headway (min) |
|---|---|
| 05,00 AM - 07,30 AM | 20 |
| 07,30 AM - 10,00 AM | 5 |
| 10,00 AM - 4,00 PM | 10 |
| 04,00 PM - 06,30 PM | 5 |
| 06,30 PM - 11,00 PM | 10 |
| 11,00 PM - 02,00 AM | 20 |
As part of creating the timetable, after some initial tests revealing that the manually created bus stops in QGIS were quite 'sparse' in some areas resulting in long walk times, we also ran a script to create bus stops at a specified maximum distance, if they weren't there already. We chose 500m for this maximum distance. The gallery below shows the difference between the previously manually placed stops in QGIS, versus those that resulted after running the update script.
-
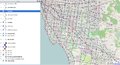 bus stop locations in Melbourne's inner sth-east, from manual QGIS work.
 -
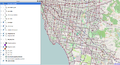 bus stop locations in Melbourne's inner sth-east, updated to include added stops to set a max stop distance of 500m.
 -
 Checking a bus route that is part of the BZE revised bus network plan in the Google Transit Data Feed library ScheduleViewer tool.


Loading these into OpenTripPlanner along with other modes, and routing tests
[edit | edit source]Then, a new OpenTripPlanner graph was created using this new bus timetable in combination with the existing tram and train timetables, using the same process as in OSSTIP/Setup of OpenTripPlanner to display Melbourne PT network.
We were then successfully able to request journey plans via the web interface on the new network, combined with the existing train and tram networks, and also calculate isochrones of accessibility via a certain time..
Below is an example of comparing a routed journey between the old and new networks.
-
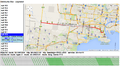
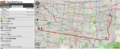
 Results of a journey request in Eastern Melbourne in OpenTripPlanner, using the existing PTV train, tram and bus networks. Request was to leave at 8AM, and fastest journey leaves at 8:37AM, arrives at 10:03AM, and requires 3 transfers.
 -
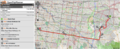
 Results of requesting the same journey, but this time with the current bus network replaced by BZE's proposed redesign and nominal schedule. The transit user is now able to leave at 8:09AM, and arrive at 9:25AM, using just one transfer - thus arriving at the destination more than 35 mins earlier.
And here is a comparison of accessibility to the Moonee Valley area in the inner N-W region on a weekday morning, on the old and new networks. This was before we added higher-density stop spacing, so notice that while the green 30-minute travelshed hasn't increased greatly, the yellow 1-hour travelshed has increased significantly, due to the enhanced bus network.
-
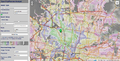 travelsheds of accessibility to the Moonee Valley area in Melbourne's inner Nth-East - on the current PTV network as of July 2013.
 -
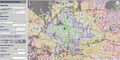 travelsheds of accessibility to the Moonee Valley area in Melbourne's inner Nth-East - on the PTV network of trains and trams, as of July 2013 but with BZE's expanded and redesigned bus network.


Note that these type of comparisons can be done manually using the interactive web-application aspects of OpenTripPlanner. But perhaps more interestingly, since OTP uses a well-defined REST AP for requesting calculations via URL, it is quite feasible to create a client script in a language such as Python to automatically select and compare travel time, location accessibility etc between network configurations.
Some caveats and lessons learnt
[edit | edit source]- OTP by default when doing a route in the journey planning interface returns the 'total travel time', but this doesn't include the wait time at the start. But one of the benefits of the BZE network is the proposed much-increased frequency and thus reduced starting waits, so in interpreting journey plans you need to carefully read the start and end time of trips, not just the total travel time.
- One possible way to visualise this well, would be to create animations at certain locations of isochrone changes throughout the day. Here's some hints on how to do this, on the OTP wiki. An example of this in use is these animations and report on microaccessibility at Matt Conway's website.
- The walking trips at the start and end of journeys have a big impact on the results. So choosing the density of stops is important, as is making sure there is reasonable coverage over the entire area. One additional issue is that walking calculations do depend quite a bit on the accuracy of the OpenStreetMap street network and tags - including the digitisation of walking access to stations.
documenting the server-creation process
[edit | edit source]Setting up a server to display the new network is something we're working on documenting better for future reference, in OSSTIP/WPBZE3.
Relationship to later WPs
[edit | edit source]Completing this WP now lays the foundation for OSSTIP/WPBZE3, setting up a live web-server running both old and new networks, to communicate the benefits and differences between them.
Possible Extensions and related ongoing issues
[edit | edit source]Re-run process for phase 2 BZE network
[edit | edit source]Depending on if work in OSSTIP/WPBZE2 and other analysis suggests network refinement is needed, we may want to re-run the process of creating an updated GTFS timetable, and displaying the results.
Testing of OTP Analyst time of day issues
[edit | edit source]Detailed checking of OTP analyst results has revealed some potential issues.
See OSSTIP/OpenTripPlanner Issues for tracking of those.
| Authors | Patrick Sunter |
|---|---|
| License | CC-BY-SA-3.0 |
| Organizations | Beyond Zero Emissions, University of Melbourne, Public Transport Users Association |
| Cite as | PatSunter (2013–2025). "OSSTIP/WPBZE1". Appropedia. Retrieved July 10, 2026. |