WPPTUA1- Developing a timetable for a higher-frequency and expanded SmartBus network
This is a Work Package as part of the OSSTIP project.
Inputs: PTUA's specification of which bus routes to improve, and what frequency to use. Working OSSTIP tools to allow sub-setting an existing GTFS network, and modifying the frequency of certain routes, to then create a new GTFS file (See OSSTIP/WP6).
Outputs: Created GTFS file of SmartBus routes with increased frequency. Modified original buses GTFS file, with the specified SmartBus routes removed.
Estimated Time: Small-Medium
Status: Complete (as at 11 March 2015).
Requirements Summary[edit | edit source]
As part of the PTUA Action-Case work in building OSSTIP, improving a selected subset of the bus network's frequency was one of the negotiated targets to analyse and communicate as part of their network reform policy proposal.
Specifically, the bus networks to increase to 10-min or lower headway, during 6am-midnight 5am-midnight (extended due to long routes, see below), 7-days-a-week, are:
- existing smartbus routes: 703, 900, 901, 902, 903, 905, 906, 907, 908
- Note:- see below that in Feb 2015 we also decided to split the very long Smartbus routes 901, 902, 903 into subsets, similar to Transdev's announced plans for the routes.
- A secondary list of routes of interest:
223, 246, 250, 402, 410, 472, 600, 630, 828, 216, 219, 220, 552, 732.- Note:- see below that after a workshop in November 2014 showing the geometry of the updated routes in QGIS, at the PTUA's request we added some extra bus routes to the upgrade list, so it became routes:
- 216, 219, 220, 223, 232, 235, 246, 250, 270, 400, 402, 410, 411, 418, 420, 446, 447, 472, 494, 504, 508, 513, 552, 556, 561, 562, 600, 623, 630, 679, 693, 732, 733, 734, 737, 767, 781, 788, 791, 800, 822, 823, 824, 828, 841, 862
Results[edit | edit source]
Initial work:- sub-setting initial GTFS bus network file into sections to upgrade[edit | edit source]
Much work was put into the OSSTIP/SimpleGTFSCreator package in late 2014 for extracting the 'abstract network topology and service' levels from an existing GTFS timetable, in order to support modification.
To simplify the task, I first added some GTFS sub-setting tools by Geometric region to reduce the number of relevant routes to process. By applying this using a polygon around "metro Melbourne", the area of interest for our network upgrades package, it reduced the number of bus routes in the GTFS from 681 (for all of Victoria) to 362.
The subsetting script in SimpleGTFSCreator is called subset_trips_by_route.py, and the resulting GTFS file in the OSSTIP_Common_LargeFile_Archives Dropbox is in the subpath:- GTFS/GTFS-ExtractedData-201406/melb-bus-gtfs-2014_06-metro.zip
I then wanted to extract just the bus routes specified for upgrading, to separate GTFS files, and then create a further GTFS file for the bus routes we weren't going to upgrade. The strategy here is that the smaller GTFS files of bus routes to upgrade could then be modified, while the remaining routes could be used as-is in calculations. This is because OpenTripPlanner has the nice feature of being able to combine an arbitrary number of GTFS files into a single 'graph' for routing analysis (as long as each GTFS file has separate trip, route etc IDs).
So with further use of the SimpleGTFSCreator subset_trips_by_route.py script, I created these new GTFS files as follows:-
- OSSTIP_Common_LargeFile_Archives/GTFS/GTFS-ExtractedData-201406/melb-bus-gtfs-2014_06-subsets/melb-bus-gtfs-2014_06-metro-smartbus.zip (9 routes)
- OSSTIP_Common_LargeFile_Archives/GTFS/GTFS-ExtractedData-201406/melb-bus-gtfs-2014_06-subsets/melb-bus-gtfs-2014_06-metro-upgrade_to_smartbus-v1-20141111.zip (14 routes)
- OSSTIP_Common_LargeFile_Archives/GTFS/GTFS-ExtractedData-201406/melb-bus-gtfs-2014_06-subsets/melb-bus-gtfs-2014_06-metro-non_smartbus_non_upgrade_to_smartbus-v1-20141111.zip (339 routes)
So the next stage was to extract the generalised network topology and service levels from the first of these two files, so we could modify them and create new upgraded versions.
Extraction process of generalised network topology and service levels[edit | edit source]
The next more challenging step in the process was to extract the topologies and service levels of each of the routes we wished to upgrade, in order to create a new GTFS file.
I had already worked-through the first version of this process, using new scripts/capabilities described in OSSTIP/WP6 and applied to the simpler train network in OSSTIP/WPPTUA3.
However the bus routes present some challenges here, as several routes involve:-
- A complete loop in the route, between a start-point and end-point. This makes the network extraction more challenging.
- And/or deviations in the route (I.E. during different trips, sometimes a different version of the route is taken).
In order to add too much complexity to SimpleGTFSCreator, both of these issues are currently dealt with in a fairly simplified way:-
- Sections of bus routes that would cause an entire loop are currently skipped;
- We extract the 'longest path' through the entire route as the generalised route pattern:- based on a similar logic to the train network, to try and avoid express services.
Generally for the bus network these simplifications seemed to work satisfactorily, and we were able to extract both topologies (in the form of route stops, segments, and orderings of segment traversal on each route), and service performance in the form of speeds on segments at different times of day, and frequency of visiting each stop.
(Note 11th March 2015:- it would be good to return to the issue of allowing looped routes though, as this may be having a non-trivial impact on network performance in a couple of cases. It needs further analysis.)
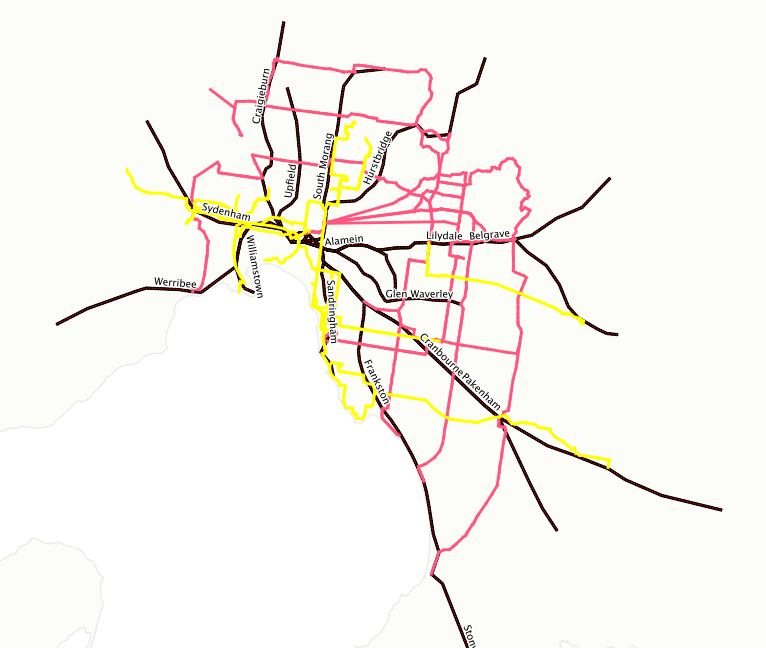
Here are some exports from a QGIS project showing these routes, in the form of:-
- The existing train network as dark red-and-black lines;
- The smartbus network sections to upgrade as pink lines;
- The non-smartbus bus route sections to upgrade in yellow.
Revising for expanded route list[edit | edit source]
As a result of sending the above image to PTUA workshop participants and discussing during one of our work-sessions in early November 2014:- we agreed to simulate upgrading a larger set of current bus-routes to a 10-minute service frequency during the periods of interest. This was as a result of aiming to get greater coverage of the Melbourne metropolitan area in the list of upgraded routes.
So once the list of upgraded routes to upgrade was decided (listed in the requirements section above), I re-ran the steps of generating sub-setted GTFS timetables, to produce GTFS files as follows:
- OSSTIP_Common_LargeFile_Archives/GTFS/GTFS-ExtractedData-201406/melb-bus-gtfs-2014_06-subsets/melb-bus-gtfs-2014_06-metro-smartbus.zip (9 routes)
- OSSTIP_Common_LargeFile_Archives/GTFS/GTFS-ExtractedData-201406/melb-bus-gtfs-2014_06-subsets/melb-bus-gtfs-2014_06-metro-upgrade_to_smartbus-v2-20141115.zip (45 routes)
- OSSTIP_Common_LargeFile_Archives/GTFS/GTFS-ExtractedData-201406/melb-bus-gtfs-2014_06-subsets/melb-bus-gtfs-2014_06-metro-non_smartbus_non_upgrade_to_smartbus-v2-20141115.zip (308 routes)
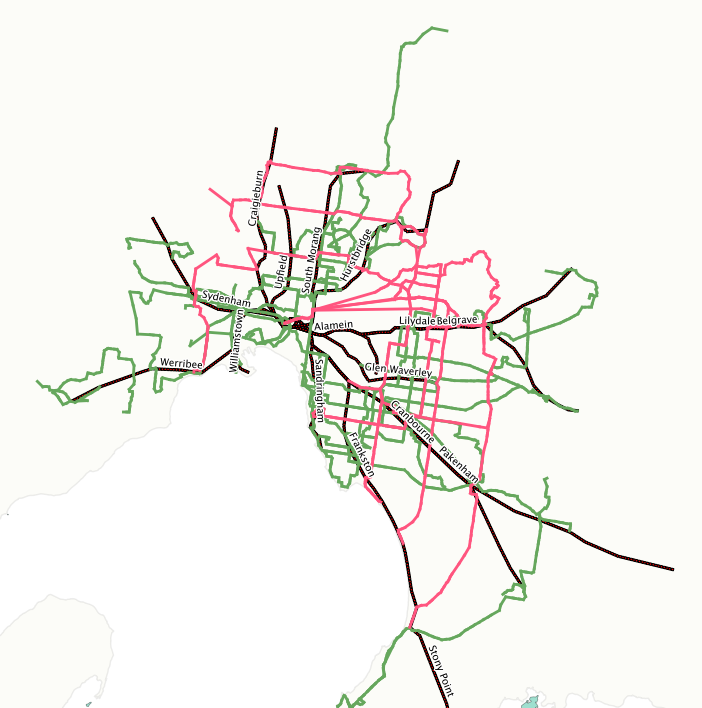
An export from QGIS showing what the topology of this second set of upgraded routes looks like is provided below, with:
- The existing train network as dark red-and-black lines;
- The smartbus network sections to upgrade as pink lines;
- The non-smartbus bus route sections to upgrade as green lines.
Workflow for creating upgraded frequency of routes and producing a new GTFS file[edit | edit source]
Once we obtained the network topology and service characteristics of the routes planned to upgrade, we could then modify these characteristics and create new modified GTFS files.
The speeds between segments, and the frequency of visiting stops, were extracted in one-hour time blocks throughout the service period.
So to fulfil the PTUA design requirement of changing the service frequency to "10-min or lower headway, during 6am-midnight, 7-days-a-week":- we simply needed to search through and modify the extracted CSV files containing these headways, and save the resulting higher-frequency versions.
This was done with a new script in SimpleGTFSCreator, increase_route_freqs.py . (This script could also add 'missing' service periods, e.g. add files for bus routes that didn't run on a Sunday, so these would be included in the new timetable).
We could then use the SimpleGTFSCreator create_gtfs_from_basicinfo.py script, using the modified route frequency in time period CSV files, to create modified output GTFS files for the Smartbus routes and regular bus routes to upgrade. These were saved at:-
- OSSTIP_PTUA/Melbourne_GIS_NetworkDataWork/bus_upgrades/output/metro-smartbus/melb-bus-gtfs-2014_06-metro-smartbus-mod_routes-upgraded.zip
- OSSTIP_PTUA/Melbourne_GIS_NetworkDataWork/bus_upgrades/output/metro-upgrade_to_smartbus-v2-20141115/melb-bus-gtfs-2014_06-metro-upgrade_to_smartbus-v2-20141115-upgraded.zip
Note:- also stored in the OSSTIP_PTUA Dropbox are Bash shell scripts listing all the SimpleGTFSCreator commands necessary to create the modified timetables.
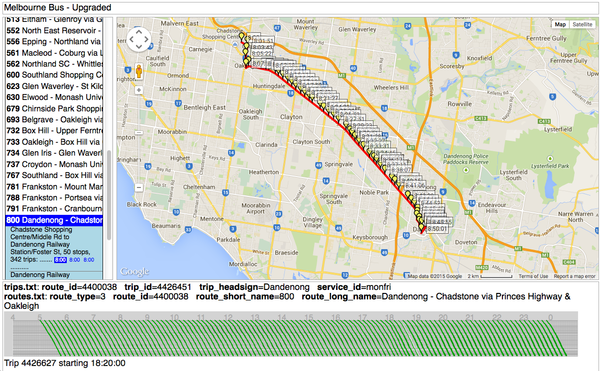
Below is an example of viewing one of the new upgraded route timetables in the ScheduleViewer web-app that comes with the TransitFeed library. Note how the time-service graph at the bottom of the image shows services at a consistent 10-minute interval throughout the service day.

Issue with very long smartbus routes, and splitting of routes as a result[edit | edit source]
While performing routing based on the upgraded timetables as part of OSSTIP/WPPTUA4 in February 2015:- we discovered a problem with the above methodology in relation to several of the very long Smartbus routes.
Essentially:- since some of these routes are over 100 km long (one-way) and take over 4 hours to fully traverse if stopping at every stop:- even with the first services starting on the routes beginning at 6AM, buses would not reach the other end of the longest routes each day until after 10AM.
This has a serious impact on trip-possibilities for journey-to-work trips in simulations.
So after discussing what approach to take to deal with this with the PTUA team, we decided on two responses:
- Split these long SmartBus routes into separate sections, per the plans of the routes' actual operator Transdev in 2015 (See this page on Transdev's website.)
- Start bus services in our revised timetable at 5AM, instead of 6AM (also part of Transdev's updated plan).
To achieve this, I wrote a new script in SimpleGTFSCreator called break_routes_subsections.py, that could read in a JSON file specifying where the routes should be split, and what the new names should be.
This worked successfully, here are some extracts of the route information before and after the breaking of the selected routes:-
before:
901 (Frankston - Melbourne Airport (SMARTBUS Service)): 103.98km
902 (Chelsea - Airport West (SMARTBUS Service)): 74.00km
903 (Altona - Mordialloc (SMARTBUS Service)): 77.35km
after splitting:
901 (Frankston - The Pines SC (SMARTBUS Service)): 55.91km
902 (Chelsea Station - Doncaster Shoppingtown (SMARTBUS Service)): 35.63km
903 (Mordialloc - Northland Shopping Centre (SMARTBUS Service)): 39.75km
911 (The Pines SC - Melbourne Airport (SMARTBUS Service)): 48.07km
912 (Doncaster Shoppingtown - Airport West (SMARTBUS Service)): 38.37km
913 (Northland Shopping Centre - Essendon Station (SMARTBUS Service)): 14.20km
933 (Essendon Station to Altona via Sunshine (SMARTBUS Service)): 23.40km
This meant the longest time to traverse fully any of the routes was 2hrs, 48 minutes.
Note:- we only followed Transdev's guidlines of where to split the routes and the new names:- we didn't also implement changing the actual geometry of one of the routes.
Issues with speed-extraction of buses from timetables[edit | edit source]
Another issue with the newly-created bus network timetables we noticed in February 2015 while working on routing journeys on the new vs old networks in OSSTIP/WPPTUA4 was that travel times between the same stop pairs seemed to have increased markedly on several of the Smartbus routes - I.E. up to 30% slower in some cases. This was having a significant impact on possible travel-times for certain trips.
This required investigating the approach to extracting generalised service characteristics from the original GTFS file for these routes using the new scripts in OSSTIP/WP6 - specifically, speed between stop pairs.
Some of the Smartbus routes seemed to be problematic in particular, in the case where they had (a) many stops close together, and (b) some segments much slower than others (e.g. going into or out of shopping centers).
After some investigation I realised that this could be addressed through modifying the parameters used in the 'speed smoothing' part of the extraction algorithm. The default parameters were more appropriate for trains, which generally run at significantly faster speeds at further spaced stops than buses. As a result of experimenting with several sets of parameters, we selected some that resulted in speeds - and thus new timetables - more similar to the existing service. These were:
- for smartbuses:- a 'minimum distance' of adjacent segments to use in speed calcs of 2.5km, and a 'minimum time' of elapsed progress along segments of 5 minutes.
- for regular buses being upgraded: a minimum distance of 1.5km, and a minimum time of 5 minutes.
With several manual tests using our OpenTripPlanner router instance afterwards, the resulting travel times between segments seem to be more directly comparable to the pre-upgrade results. (Further, semi-automated testing would be good, but isn't something we plan to pursue in the short term).
Outputs summary[edit | edit source]
Thus we now have three output GTFS files which together, can be used to route trips on the modified and upgraded bus network, per PTUA's request:
- OSSTIP_PTUA/Melbourne_GIS_NetworkDataWork/bus_upgrades/output/metro-smartbus/melb-bus-gtfs-2014_06-metro-smartbus-mod_routes-upgraded.zip (13 routes)
- OSSTIP_PTUA/Melbourne_GIS_NetworkDataWork/bus_upgrades/output/metro-upgrade_to_smartbus-v2-20141115/melb-bus-gtfs-2014_06-metro-upgrade_to_smartbus-v2-20141115-upgraded.zip (45 routes)
- OSSTIP_Common_LargeFile_Archives/GTFS/GTFS-ExtractedData-201406/melb-bus-gtfs-2014_06-subsets/melb-bus-gtfs-2014_06-metro-non_smartbus_non_upgrade_to_smartbus-v1-20141111.zip (339 routes)
Running the upgraded sections of the bus network at 10 minutes frequency results in a change in the estimated number of required buses in peak hour (8AM weekdays) from:
- 143 to 231 on the Smartbus network;
- 255 to 612 on the 45 regular routes being upgraded in frequency.

