
Size of this preview: 800 × 462 pixels. Other resolution: 1,244 × 719 pixels.
Original file (1,244 × 719 pixels, file size: 126 KB, MIME type: image/png)
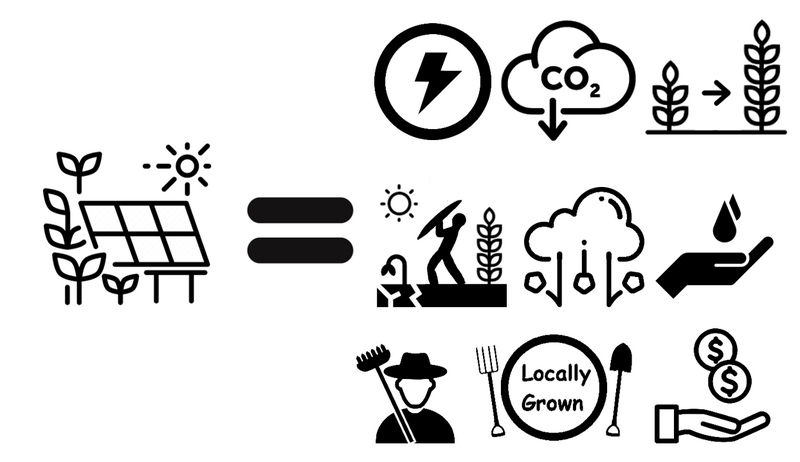
This is an agrivoltaic infographic. It shows the services provided by agrivoltaics are a) renewable electricity generation, b, decreased greenhouse gas emissions, c) increased crop yield, d) plant protection from excess solar energy, e) plant protection from inclement weather like hail, f) water conservation, g) agricultural employment, h) local food and i) increased revenue.
File history
Click on a date/time to view the file as it appeared at that time.
| Date/Time | Thumbnail | Dimensions | User | Comment | |
|---|---|---|---|---|---|
| current | 13:02, 27 December 2021 | | 1,244 × 719 (126 KB) | J.M.Pearce (talk | contribs) | Uploaded own work with UploadWizard |
You cannot overwrite this file.
File usage
The following file is a duplicate of this file (more details):
- File:Agrivoltaic-infographic.png from Wikimedia Commons
The following 35 pages use this file:
- A First Investigation of Agriculture Sector Perspectives on the Opportunities and Barriers for Agrivoltaics
- Advancing Agrivoltaics within the U.S. Legal Framework: A Multidimensional Assessment of Barriers & Opportunities
- Agrivoltaic potential on grape farms in India
- Agrivoltaics Canada
- Agrivoltaics in Ontario Canada: Promise and Policy
- Aquavoltaics: Synergies for dual use of water area for solar photovoltaic electricity generation and aquaculture
- Coal with Carbon Capture and Sequestration is not as Land Use Efficient as Solar Photovoltaic Technology for Climate Neutral Electricity Production
- Conceptual Design and Rationale for a New Agrivoltaics Concept: Pasture-Raised Rabbits and Solar Farming
- Design and Implementation of 3-D Printed Radiation Shields for Environmental Sensors
- Design of a low-cost mobile multispectral albedometer with geopositioning and absolute orientation
- Do agrivoltaics improve public support for solar? A survey on perceptions, preferences, and priorities
- Dual use of land for PV farms and agriculture literature review
- Energy Modeling and Techno-Economic Feasibility Analysis of Greenhouses for Tomato Cultivation Utilizing the Waste Heat of Cryptocurrency Miners
- Energy Policy for Agrivoltaics in Alberta Canada
- FAST
- Greener Sheep: Life Cycle Analysis of Integrated Sheep Agrivoltatic Systems
- Integrating solar energy with agriculture: Industry perspectives on the market, community, and socio-political dimensions of agrivoltaics
- Life cycle assessment of pasture-based agrivoltaic systems: Emissions and energy use of integrated rabbit production
- Low cost climate station for smart agriculture applications with photovoltaic energy and wireless communication
- Maximizing Biomass with Agrivoltaics: Potential and Policy in Saskatchewan Canada
- Open-Source Vertical Swinging Wood-Based Solar Photovoltaic Racking Systems
- Optimal inverter and wire selection for solar photovoltaic fencing applications
- Parametric Open Source Cold-Frame Agrivoltaic Systems
- SDG02 Zero hunger
- SDG08 Decent work and economic growth
- SDG12 Responsible consumption and production
- Solar Photovoltaic Powered On-Site Ammonia Production for Nitrogen Fertilization
- Test page for FAST
- The Agrivoltaic Potential of Canada
- The potential for fencing to be used as low-cost solar photovoltaic racking
- The potential of agrivoltaic systems
- Western Innovation for Renewable Energy Deployment (WIRED)
- User:J.M.Pearce
- Template:Pearce-agrivoltaics
- Category:FAST Completed