
OSSTIP/Project blog

| Type | |
|---|---|
| Authors | |
| Status | |
| Years |
Intro
[edit | edit source]This is a blog-style page by PatSunter about publicly-shareable learning, information and reflections arising from the OSSTIP project.
The idea is to reflect on and share useful ideas about the tools evaluated in the Open Source GIS-T Public Transport Tools Review, and how well they support my project collaboration partners (Beyond Zero Emissions and the Victorian Public Transport Users Association) in developing alternative paths forward for Melbourne's transport system. It is a component of the "Action-Research" aspect of my PhD.
If you'd like to comment at the end of entries:- that's fine, but please use Appropedia conventions of signing your posts using the --~~~~ formatting.
Entries
[edit | edit source]2013-07-18:- Working with GTFS transport schedules, and promising start with OpenTripPlanner's capabilities
[edit | edit source]Last week was a good week working on the project with Beyond Zero Emissions (BZE). They are working in parallel still on their high-speed rail study, but also have a couple of people already working on their Melbourne case study of options for de-carbonising transport in the Melbourne Metro region.
Learning about GTFS, and relevant tools like TransitFeed
[edit | edit source]Thus far, my focus has been on setting up and evaluating Open Source tools that can effectively work with public transport networks and timetables (in GTFS form), and perform analysis thereof (OSSTIP/WP3) - and the data these tools need/use/produce (OSSTIP/WP1).
In this I had the much appreciated support of a friend who has developed Python scripts to transform the the database of Melbourne's public transit we had access to into GTFS format. His scripts used some open-source libraries and tools, TransitFeed. The latter include some nice validation and data exploration tools, like the ScheduleViewer web app (see screenshot below).
The data still needs some work, especially the bus network - but it was enough to start the next step. I would say that just by using the tool for a while, it helped get a better handle on the geography and layout of Melbourne's public transport system. This chimes in well with one of developer Andrew Byrd's stated goals for OpenTripPlanner Analyst, of being able to "better grasp the syntax of the urban environment and factors favoring spatial legibility for those of us navigating it via shared, scheduled and non-motorized transport."
This included for me realising just how complex Melbourne's current bus network is:- as one example, I noticed several route numbers are duplicated between areas of Melbourne and Victoria's regional towns. So improving the bus network does seem a worthwhile area to focus effort moving forward. I realise given Melbourne's history of privately-owned buses, the institutional aspects of this will be tricky, as my GAMUT colleagues like to point out ;) However, at least with this project we should be able to propose some useful ideas for the network itself.
First tests of OpenTripPlanner
[edit | edit source]The next step was exploring which OS tools best supported analysis operations on the data such as routing and calculation of isochrones etc, as per project WP2:- Open Source GIS-T Public Transport Tools Review.
In this respect, OpenTripPlanner has offered the best mix of performance/usability so far. I did check out GraphServer, which might require less dependencies - but does seem more of a research, "DIY-tool", without too much user docs or 'hand-holding' to get you up and running. In contrast, OpenTripPlanner, while not having a perfect manual, has put in quite a lot of effort it seems e.g. by having an entire distribution you can download and install in one step, and also they provide "2-minute intro" and "5-minute detailed dive in" tutes on the project Wiki (see either of those pages for links to the download). For an Open Source project, I like this approach, as it helps people get over the initial barrier of using the software.
Note:- you are going to want to have a good internet connection though for this - the binary distribution is ~60megs, and the sample OpenStreetMap and graph files are 100mb+.
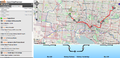
By mid last week I was able to get it to calculate and visualise travel time maps based on Melbourne's current PT network – e.g. screenshot attached of trip isochrones to Monash Uni Clayton.
My next step will be to investigate the ability of OpenTripPlanner, or possibly the OSAT plug-in developed on top of it by a US researcher (https://github.com/Noblis/OSAT), to do TAZ-based trip distribution calculations using OpenTripPlanner. While OTP is Java-based and is oriented towards presenting results on the Web using a REST design, it can be scripted to run in batch mode for these types of calculations. We are keen to test performance and see how it stacks up against the other tool the BZE guys are using for this.
-
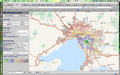
 OpenTripPlanner being used to plan routes in Melbourne
 -
 OpenTripPlanner Analyst functionality, showing Travel time maps to Monash University in Sth-East Melbourne.


Data Conversions and Github
[edit | edit source]Notably, a lot of the 'Open Source' work so far has involved scripts to transform data from one format to another – which gels with what full-time GIS project people tell me as a major time-absorber.
I was pleasantly surprised though that another BZE volunteer working on some of these already added them to a version controlled Github repository without my intervention – so BZE's first open source project was actually endogenous ;)
2013-08-29:- Making some progress with OTP Batch Analyst for calculating OD Matrices and more advanced visualisations
[edit | edit source]Map of Melbourne's Train Station Accessibility from Other Train Stations
[edit | edit source]Probably the best test so far on OSSTIP/WPBZE2 to test OpenTripPlanner's batch routing capabilities is this example of displaying Melbourne's train station accessibility from other train stations. The values vary from between just over 40 minutes, to a bit over 2 hours.
(It's a very simple metric thus far, as it takes no account of the 'value' of the other destinations, either for their 'centrality', or job/population catchment).
I used QGIS to create the visualisation:- it's really quite a capable tool once you get over the learning curve.

My Email about OTP's default maxTransfers value
[edit | edit source](Moved to OSSTIP/OpenTripPlanner Issues#Concerns about maxTransfers value too low by default).
2014-03-18:- Updates on last ~6 months of work with BZE
[edit | edit source]The last six months work on trialling the OSSTIP platform for use within Beyond Zero Emissions's (BZEs) Zero Carbon Australia Transport project (ZCATP) have been both busy, and productive.
As detailed in some of the Work Package notes like OSSTIP/WP2 and OSSTIP/WP4, we've settled on using OpenTripPlanner (OTP) as the main journey planning and network analysis tool for purposes of analysing the effectiveness of BZE's network and schedule improvement proposals.
We're now starting to push beyond the basic OTP capabilities to create more customised visualation and analysis results and workflows for this project. I'll start with an update on the technical aspects of this, followed by a reflection on some of the learning process around using advanced Open source software in this kind of project.
Work on displaying 'Virtual Future Timetables' in OpenTripPlanner, and feedback on this as a communication tool
[edit | edit source]Of course our main aim in using OpenTripPlanner is as part of a larger workflow analysing and communicating the potential benefit of revisions to Melbourne's public transport network, structure, and frequency.
In this respect, the BZE transport team have been making extensive use of Quantum GIS as our desktop GIS tool to manage designing modifications to networks, lines, and interchanges. This has probably been one of the significant aspects of the project in terms of user time.
Then, with a lot of help from one of the other BZE project volunteers, we developed a workflow to convert these networks via a set of stages into a new system-wide timetable, written mostly in Python and drawing on other GIS software. There is some description of this process in OSSTIP/WP5. N.B.: - Calling the repository of scripts I created for this process 'SimpleGTFSCreator' was deliberate, as the timetable creating capabilities are currently pretty simplified, e.g. currently we don't support issues like express services.
Nevertheless, it was exciting to be able to start checking the routes and times in the Google Transit Data Feed ScheduleViewer tool (see fig below), and then to start comparing how journey patterns would change in this future 'Virtual Timetable' in OpenTripPlanner, as compared to in the current network (example included below). This means that task OSSTIP/WPBZE1 is now largely complete, bar better documentation.
Below are some images, included from the above page, showing the use of OTP in comparing changes to journeys once a better bus system is installed (See OSSTIP/WPBZE1 for more):
-
 Results of a journey request in Eastern Melbourne in OpenTripPlanner, using the existing PTV train, tram and bus networks. Request was to leave at 8AM, and fastest journey leaves at 8:37AM, arrives at 10:03AM, and requires 3 transfers.
 -
 Results of requesting the same journey, but this time with the current bus network replaced by BZE's proposed redesign and nominal schedule. The transit user is now able to leave at 8:09AM, and arrive at 9:25AM, using just one transfer - thus arriving at the destination more than 35 mins earlier.
Myself and BZE have now demonstrated this kind of functionality in two talks, one a collaborative talk to the Melbourne Metropolitan Transport Forum in December 2013, and a second by BZE at the 2014 Sustainable Living Festival. See OSSTIP#Talks, Media, and Academic Publications Related to the Project. Preliminary indications suggest this will be a valuable way of communicating the impact of timetable and network changes to stakeholders and the public.
OpenTripPlanner has also proved useful in assessing how effective the network redesign would be in serving different trips over the Melbourne Metro area - using a "batch routing" capability extended from work in OSSTIP/WPBZE2. It suggested that in many areas trip times were reduced on the redesigned network, while there were some places where trip times increased (mainly concentrated in the outer Northern suburbs, where it seems we made the bus network too sparse).
So, work is already underway at BZE to create a "Version 2" bus network re-design that aims to address some of these issues - as well as different permutations that include light and heavy rail network upgrades. More on this next update.
Creating Virtual Machines of OSSTIP stack
[edit | edit source]Before the BZE talk at the Sustainability Festival in February, I decided to get serious about creating proper 'Virtual Machines' with OpenTripPlanner installed and set up with all necessary data.
A "Virtual Machine" (VM) is a special image of an entire operating system, that can be 'virtualised' from inside a 'host' computer, if the 'host' computer is running special virtualisation software. There are both commercial proprietary VM software tools, but also an open source one with good capabilities, VirtualBox.
The benefit of using VMs in this kind of project and context is, I think:
- Version control and archiving:- in case key volunteers and developers leave the project or are reassigned, having a working VM can help re-construct any necessary installation and configuration know-how, to help later people get up to speed quicker;
- Creating a 'production-ready' version for the web:- Running complex applications like OpenTripPlanner on the web is different to running them for personal development - on web versions, its likely performance at handling multiple users, setting things up in a simple way with minimal extras, and security are higher concerns. Using VMs you can create a separate "web-ready" version so this work can be done & tested before actually putting online (See OSSTIP/WPBZE3.
- Portability:- once you have a working VM configuration, it should make it easier for multiple team members to install and set up needed software for both use and demonstrations. This is especially the case where team members use different OSs, e.g. OpenTripPlanner and needed Java software libraries and tools are probably quite challenging to install on a Windows system, especially for those without Linux/Unix training or experience.
So, we do now actually have VMs with a 'lean' version of necessary software stack to run OpenTripPlanner over the web, pre-loaded with appropriate data - see update at OSSTIP/WP3#2014-03-19 update. This did represent a nice little 'milestone' for me, to have all the know-how developed in running OpenTripPlanner for the kind of analysis we want, encapsulated in a little virtual server that you can just 'Start' and 'Stop'!
As well as facilitating running an actual live web-server version of the OSSTIP platform running with BZE's proposed network reforms, having these VMs has also facilitated some more methodical testing of OpenTripPlanner's accessibility functions (see the final section of this update).
Working towards a launch of an OTP server with BZE's work
[edit | edit source]Finally, we are fairly close now to actually being able to run a live instance of OSSTIP showing BZE's proposed network reforms, as part of engaging the public and stakeholders with the potential impacts of these changes.
See the latest update at OSSTIP/WPBZE3#2014-03-19.
We are planning a major work-session on this in the following week, including BZE staff preparing version 2 of the network redesign, in order to try and get this launched by April.
Progress on using OpenTripPlanner more generally, reflecting on the learning process
[edit | edit source]OTP's core routing capabilities are good - when you delve a little into the relevant literature of routing on large timetabled networks, it is really quite a challenging task - so it is a big help we can use the concentrated capabilities of the collective contributors to OTP over the years who've developed a workable approach to these issues.
Of course, learning how to use OTP certainly hasn't been without its challenges - I for example have had to re-familarise myself with the Eclipse Integrated Development Environment as the recommended way for working with the codebase, but getting started instructions here are reasonably well-documented on the OTP wiki. As someone whose main programming background was in developing either high-performance computing server applications and frameworks in the C or C++ languages (Underworld and StGermain), and then later various workflow scripting, analysis and workflow tools in Python for scientific computing (CREDO). Fortunately, one of my latter projects at my employer before I began the PhD, wikipedia:VPAC, included further development of a Java Tomcat-based combined web and server application with at least some similarities of underlying structure to OpenTripPlanner, so that gave some useful experience in 'wrangling' this kind of codebase to do what you'd like to do.
As I've started to use OTP more regularly, I've started to follow the OTP-user and OTP-developer mailing lists more closely, to follow the project's progress.
There are several interesting things happening to the project as they work towards a 1.0 release.
- The 1.0 software architecture has been significantly redesigned compared to the 'stable' branch that I've been using in OSSTIP work, 0.9.2. There have also been discussions recently about a continued and perhaps more radical simplification of the configuration and publishing aspects of the application in future, to try and reduce some of the complexities involved given its initial design as a Java Tomcat servlet and build tools like Maven.
- There's also been talk of a more advanced API for representations of mode change requirements during travel, as well as ways to be more efficient with RAM memory while still maintaining speed to allow dealing with ever-larger graphs.
I think what all of this illustrates is the fact that large open source codes are complex beasts, and that successfully dealing with complexity is a big challenge and the ways developed to do that successfully has been one of the most interesting things to come out of the free-and-open-source software world. As with all Open source software, there is a challenge between stability and merging new features and improvements, and the governance of this given different interests of different participants in the project. Free, or low-cost, configuration management and issue-tracking tools and platforms like Github are definitely a big part of this picture of allowing global collaboration, but each project has its own culture to understand and work with too. This is one of the things discussed in the book Understanding Open Source Software Development that I'm currently reading, as well as Karl Fogel's Producing Open Source software book - the latter freely available over the web and published under a Creative Commons linense.
Of course, as initially "users" of OpenTripPlanner in this project we've tried to abstract ourselves from some of this development complexity, and have to make decisions on how to best do this, e.g. choosing to use a stable 0.9.2 version instead of the latest development 'trunk' version. However, as we increasingly become 'power users' of the code pushing its capabilities in areas like batch routing and analysis, and potentially even developers of new features, we do need to get increasingly involved in these kinds of discussions. That's going OK in the context of the BZE work so far, but is definitely a challenge to balance a close involvement with the internals of the code with 'getting things done' in the kind of context needed by BZE and other civil society organizations.
One of the things I'd like to reflect upon later in the project is whether BZE, myself, and other local stakeholders in OSSTIP would need to work together in some kind of collaboration to be able to keep working on this kind of thing longer term.
Organisational and Governance Changes in relation to OpenTripPlanner
[edit | edit source]An interesting governance and 'mode of production' change in the OTP project over the last 6 months has been the spinning out of the project's from its former institutional 'home' as part of the organisation OpenPlans, (originally the 'Open Planning Project'), into a new dual structure, as initially announced in this mailing list post:
- The transfer of the rights to the code to the Software Freedom Conservancy (SFC), an organisation set up expressly to create a legal structure for management of FOSS codes long-term;
- Simultaneously, the set up of a new consultancy company focusing on transportation software development Conveyal, 'an open data / open source focused transportation consultancy that has taken on the work we began together at OpenPlans'.
While this is a complex issue, one preliminary opinion I'd proffer is that this approach to long-term sustainability of the project does compare favourably to that adopted by the UK CSO MySociety in their handling of Mapumental, which after an initial period of Open Source work chose to continue work on the codebase in a proprietary manner in a spin-off Mapumental company. I understand there were some grant conditions on their initial funding that constrained this choice though, so it is a complex issue.
At any rate, thus far OTP's change of governance structure hasn't had any impact on the code's continued availability for use and further development.
Some issues with OTP Isochrone calculations at different times of day I've raised with the OTP community
[edit | edit source]One way of illustrating the kinds of issues in using an Open Source code in this kind of project is what happens when you realise a feature of the code doesn't work as you intended, or there appears to be a bug.
As part of some more detailed investigation of OpenTripPlanner's travel time isochrone calculation and display capability I was doing - both for the sake of the BZE work and in collaboration with some other Melbourne Uni researchers looking at transit-oriented development possibilities around Melbourne - I came upon a a few issues with the way OTP calculates isochrones at different times of day - especially late in the evening.
See OSSTIP/OpenTripPlanner Issues#Concerns with accuracy of OTP Analyst Isochrones in late evening or overnight, for links to the actual issue report and OTP mailing list entries.
Again, this is one of the aspects of working with and using a significant-scale Open source software project - how to assess features before you start to see if they're what you need, and also to decide how to respond if a feature you realise you need isn't there, or you find a significant issue in the code relevant to your work. A good web resource discussing this issue is this one by Nick Barnes, rather colorfully titled 'don't believe the hype' - I.E. do some due diligence when assessing FOSS tools, and recognise in some cases you'll need to develop new features that you really need yourself. Of course another of Nick's rules is to find a strong community, and OTP seems to cover that quite well, with its diverse range of stakeholders globally including transit agencies and researchers. I've got a good response to reporting the issue from lead developers, so am cstill working out whether I will have to do some bug-fixing myself.
2014-04-11:- Increasing time-table realistic-ness
[edit | edit source]We're now close to having updated BZE networks and timetables, for both a 'revision 1', and a 'revision 2' re-design, and then being able to run OpenTripPlanner to test their performance. This is being tracked in OSSTIP/WPBZE4. As detailed on that page, its resulted in us increasingly the realisticness of the timetable-generation scripts in OSSTIP to deal with the possibility of road-network congestion for buses.
We are also progressing towards being able to host OpenTripPlanner instances on a live public web-server, to help with communicating these network reform plans to the public. See OSSTIP/WPBZE3. As part of this, I've been working with an OpenStreetMap expert here at Melb Uni to both improve the quality and appropriateness of map tiles used, as well as simplify the deployment process to virtual machines in the 'cloud'.
Stay tuned for more updates on these, hopefully in the next month or so!
2014-08-30:- Finished key round of BZE Work packages, assessment results, melbptfutures.net server
[edit | edit source]By the end of August, I finished key work packages with BZE as part of the first Action-Case of the project. In particular, we were able to create full GTFS timetables for their two broad network redesign concepts, now named "V1.2" and "V2.0".
The results of these simulations should make their way into a BZE report on urban transportation in due course. We would also like to do some further analysis on these results later, as time permits (however due to Pat's PhD constraints, we did need to put bounds on this action-case, to allow time to also work with the PTUA, and complete the full writing stage of the research).
In particular from a technical point of view:- while we understand that OpenTripPlanner's Batch Analyst is still an experimental feature:- it would definitely be great to get further information from OTP about the routes used during a batch simulation. We know it is doing a detailed path-finding simulation for each route, including information of exactly which services are used and when:- however that information isn't saved for further analysis. That sort of information would be very useful to extend the utility of OTP as a 'network planning and analysis decision-support tool'.
Both the interactive journey planner, and analyst capabilities of OTP, are now running and loaded with the BZE timetable on a public website:- see http://analyst.melbptfutures.net/ and, for the moment, http://bze.melbptfutures.net/ (we plan in future to integrate all these services under a nicer front-page at the melbptfutures domain). Both Pat and BZE are interested in the potential of such an interactive platform, to supplement more traditional written reports in helping people understand the potential of a modified transport network.
2014-11-05:- Begun 2nd Action-Case with the PTUA, Inaugural TransportCamp AU Participation
[edit | edit source]Working with the PTUA:- modelling key elements of the 'every 10 minutes to everywhere' plan
[edit | edit source]In September, I actually began working with the Victorian Public Transport Users Association (PTUA) as a 2nd action-case study as part of my PhD, in further evaluating, developing and applying the OSSTIP platform to test its efficacy in analysing and communicating their public transport network policy proposals.
The PTUA have a 20+ year history of advocating for improved public transport in Melbourne, and its also where respected and innovative public transport researcher and advocate Prof. Paul Mees worked in the 1980s and 1990s and begun developing his ideas about the 'network effect' of how to best organise an intermodal, metropolitan-wide network. So it is an honour to be working with them, and the timing has worked out well since we are in the lead-up to a Victorian state election where transport will again be an important area of policy discussion and debate.
From a technical point of view, the PTUA collaborative work is quite different to that undertaken with BZE:- since in the PTUA's case, they mainly want to evaluate a range of modifications of the existing network and timetable for each mode, rather than focusing on an entirely new network and timetable for one mode.
As such, the first major phase of work has been to work on modifying and improving the OSSTIP Package and scripts to deal with an GTFS timetables, transform them into a more abstracted and simplified format, and then allow modifications to this before creating a new timetable. So I have listed this as a new regular OSSTIP work package, OSSTIP/WP6. Work on this so far is progressing well, but it has resulted in the "SimpleGTFSCreator" package becoming notably more complex, so the name is not so appropriate ;) E.g. I've started using more object-oriented classes in the scripts to try and improve cohesion and appropriate abstraction in the scripts, drawing on my software engineering training and experience. I even brought to Uni my favourite software wikipedia:Design Patterns book. I likely need to start writing better test harnesses for the code too, and the expanding functionality means it becomes laborious to re-run a range of test cases manually.
I've also found that the complexity of real timetables in Melbourne, especially our train network with different expresses, and branch route extensions with lower frequency, adds a real degree of challenge to the work. Still, we seem to have relatively satisfactory solutions now to create a workable network abstract representation from the timetables, without undue manual work as part of the process.
Once that capability is fully working, I will turn full focus to actually developing modified timetables for Melbourne's buses OSSTIP/WPPTUA1, trams OSSTIP/WPPTUA2, and trains OSSTIP/WPPTUA3 in collaboration with several PTUA members working on the project. We have already held two worksessions on this, and hope to get some preliminary analyses completed in the next couple of weeks.
TransportCamp AU Participation
[edit | edit source]On this Saturday 1st of November, I participated in the inaugural Australian "TransportCamp" unconference in Melbourne. It was interesting and stimulating, and good to see many others really interested in transport issues. I gave a presentation, with assistance from Laurent at BZE, about OSSTIP and the results from the BZE work especially (See the slides I used in support).
Then on a personal note re transport after the conference:- in journeying to see a friend and watch some music in Thornbury on Saturday after the conference, I decided to take a tram and bus combination, as recommended by the PTV's Journey Planner. However:- the bus service (line #510) that was supposed to connect with my tram departed 1 minute early (I saw it leave while still on the tram):- and the next bus was a full 40 minutes later! So I decided it was quicker to walk. Then, hoping to make the reverse trip home at 11:30PM after the concert:- I found that the 510 bus finished service at ~9PM on a Saturday night!
This experience really brought home to me the need to strongly advocate for a well-planned, well-managed, and properly funded intermodal public transport system in Melbourne running at a good frequency:- if we are to give people a workable and dignified alternative to taking the private car for the majority of their journeys, and achieve related environmental and other benefits. Public transport needs to support cross-town recreational and shopping trips, not just radial journeys-to-work (and even most journeys to work in Melbourne aren't just radial now).
This to me re-affirms the need to provide the technology to design and communicate such a system more broadly. And it further affirms why allowing using such tools for advocacy as well as technical analysis is appropriate:- this is not just a hypothetical 'academic exercise', but is about putting forward an alternative that we think will improve the equity and efficiency of our urban systems for millions of citizens!
| Authors | Patrick Sunter |
|---|---|
| License | CC-BY-SA-4.0 |
| Organizations | Beyond Zero Emissions, University of Melbourne, Public Transport Users Association |
| Cite as | Patrick Sunter (2013–2024). "OSSTIP/Project blog". Appropedia. Retrieved July 13, 2026. |