
HEIF Solar Monitoring System

| Type | |
|---|---|
| Authors | James Robinson James Apple Peter Johnstone Heidi Benzonelli Andrea Allen Ranjit Deshmukh Colin Sheppard Lucas Siegfried ERE Professor Arne Jacobson Kristen Radecsky Juliette Bohn |
| Location | Arcata, California |
| Status | |
| Years |
The Solar Radiation Monitoring Station project is one of Humboldt's Renewable Energy Student Union's responses to the need for more renewable energy. The basic idea behind this specific system is not to create power but to collect information on solar power. As demonstrated in Fig.1, the usable Solar Radiation is more complicated than simply what the sun emits. The atmosphere which the radiation travels through needs to be taken into account due to it's distorting effects on usable energy at the earth's surface.

Because of the localized weather in coastal zones, most solar research facilities do not deal with the thick cloud cover found there. The focus of the SoRMS project is to collect local solar radiation data and make that data available to the public. Although conducted in Arcata on the northern coast of California, the SoRMS project is producing data that will help to fill in the informational gap for other areas with similar atmospheric conditions. In this manner SoRMS is contributing to a more comprehensive idea of the energy that can be expected from solar systems. With measurements of local solar energy, people will have a better idea about solar power's productivity in areas that experience more clouds and fog. This information can be used to help determine solar array sizing, battery storage requirements, and project payback including CO2 emission offsets.[1]
How The Project Works
[edit | edit source]The amount of energy coming from the sun is measured with the use of an Eppley Precision Spectral Pyranometer (PSP) seen in Fig.2. This measurement is done by comparing the heat absorbed through radiation of an absorptive black surface with that of a reflective surface. There are two of these PSP's; one is in the open sunlight and one is covered by a shadowband. The shadowband is seen bent around the PSP on the right of Fig.3, and is only blocking the direct sun light.
The PSP that is exposed to direct sunlight measures global radiation which is a composition of direct radiation, coming straight from the sun directly to the PSP and the diffuse radiation which is other light waves that have been bounced, bent, or reflected though the earth's atmosphere. The second PSP, with the shadowband blocking the direct radiation, only receives diffuse radiation. By using the data from each of these PSP's, the diffuse radiation is subtracted from the global radiation to obtain the amount of direct radiation which is the primary source of solar energy.[2]
The diagram in Fig.4 shows what happens inside the PSP. As the solar radiation comes from the sun, it is then transmitted through the top UV glass dome. Visible light, with the exception of small amounts of red light, is filtered first using a UV transmitting black glass. The light that passes through this filter hits a UV-B sensitive phosphor. The phosphor collects the UV light and sends it back as visible light, mostly as green light. Then another glass filter, this time green, sends the light from the phosphor filter and blocks the remaining red light that may have passed through the black glass. The light's intensity is then measured by the solid state photodiode.[3]
-
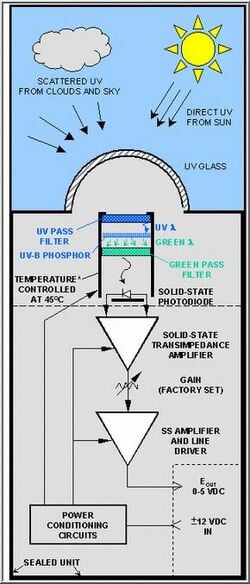 Fig.4 A visual representation of what goes on inside of a PSP http://web.archive.org/web/20181112134626/http://yesinc.com:80/products/data/uvb1/uvb1 img1.gif
 -
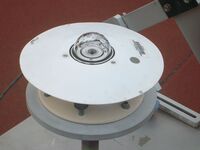 Fig.2 Eppley Precision Spectral Pyranometer (PSP)
 -
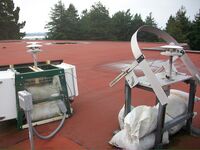 Fig.3 The unobstructed PSP to the left measures global radiation while the PSP on the right measures only diffuse radiation with the use of a shadowband.


Project Progression
[edit | edit source]The project began as the idea of two students, David Carter and Dustin Jolley. These two students realized the usefulness of reliable and local solar energy data. With help from faculty, they received a grant for the purchase of two PSPs before they graduated. Leaving behind this necessary equipment left the door open for someone to pick up where they left off. In 2006, RESU got the system running and began measuring solar radiation on California's northern coast.
In general, data on solar radiation in coastal areas is scarce and thus there was a demand to get Arcata's data into a more comprehensive system. The solution was the National Renewable Energy Laboratory (NREL). In these beginning stages, the information collected had to be collected from the site and entered by hand into a computer. This data was then emailed to NREL. Data was obtained continuously except when the PSPs were shipped out to be re-calibrated. Because of the somewhat haphazard way the information was being conveyed to NREL, and the interruption of data while recalibrating, SoRMS could not acquire the status of what NREL calls a "primary site". In order to make the most out of the project, SoRMS saw this as the next necessary step.[4]
In order to be considered a primary site, SoRMS had to have the ability to pass continuous data directly to NREL. Two improvements would make the project compliant with NREL standards. An Ethernet jack was installed and another PSP was purchased. With the Ethernet transmitting the information directly from SoRMS to NREL and a third PSP allowing recalibration to take place in rotation, the SoRMS project would now become a NREL primary solar monitoring site.[5]
How To Access Data
[edit | edit source]The data that SoRMS produces is collected by a Campbell Scientific CR510 data logger, and connected to the Internet using a NL-100 Network Link Interface. With this Network Link Interface, the information collected by the SoRMS project is now promptly accessible to the public as and in a Calendar View. It also allows NREL access to download SoRMS data remotely which also has a link to the data. The graphical interpretation of a day's data is shown in Fig.5.[1]

Making Use Of SoRMS Data
[edit | edit source]With access to information on the direct radiation in the area, one is able to make use of it in several ways. By averaging the Daily Data, one can calculate average daily solar radiation levels. This information can be of use to engineers building passive solar power in the area, as they can get an idea of energy input and determine the necessary scale of the operation. If there is not much solar radiation in the area, there would need to be more panels to produce the necessary energy. With more radiation in the area, there would not need to be as many panels for the same energy output.[6]
Local farmers and gardeners can use the data to decide what crops would be ideal to grow based on the amount of sunlight available, as well as determine the proper harvest times based on past data. With the monthly data, it would become possible to see yearly solar radiation highs and lows, and thus decide on ideal dates to plant and harvest different crops.
Having access to information about solar radiation, one can find out when a solar power project would begin to pay itself off, or in some cases if it would payoff at all. By examining graphs, one can get an idea of the local climate as well. Frequent short arcs indicate that the location is not as sunny, leading one to assume there are often clouds or other forms of weather present in the given location. The opposite would be shown by long, tall arcs on the graph where more sun could be expected.[4]
Maintaining The Project
[edit | edit source]The SoRMS project is maintained by California's Cal Poly Humboldt (HSU), Renewable Energy Student Union, which collaborates with the Schatz Energy Research Center. All the people working to keep this project running are volunteers. These volunteers keep the information as accurate as possible by maintaining the consistency of the system. Every morning one of the volunteers clears the PSPs of any dew accumulation and adjusts the shadowband. The dew accumulation, if left on the PSP, can cause short term spikes and holes in the energy absorption due to the light bending as it passes through dew droplets. The shadowband is adjusted according to the earth's rotation and position of the sun.[6] Seen below in Fig.8 are some of the people who are integral to the project's continued operation.[7]
-
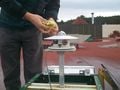 Fig.6 Aaron Parker wiping off dew
 -
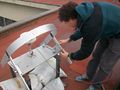 Fig.7 Aaron Parker adjusting the Shadowband


Future Projects
[edit | edit source]The SoRMS project has been completed, however there are some improvements that would take care of the issues found in the system. With these issues fixed, the SoRMS project would also become able to collect data for the National Renewable Energy Laboratory(NREL). There are two problems within the operating system, one is the lack of a backup PSP. Every two years the Eppley Precision Spectral Pyranometers have to be sent back to the National Renewable Energy Laboratory for recalibration. This process takes two monthes, putting the data logging on hold for that period of time. The proposed solution is to purchase another PSP, making it possible to have a continuos data log at all times throughout the year.
The next issue with the SoRMS project is its lack of direct access by the NREL. With a direct link to NREL, the SoRMS project would be able to become a primary solar monitoring site. A "primary site" is what the NREL calls the various locations from where they get their national data. The SoRMS project provide data for California's North Coast, an area that the NREL does not have any measured data. There are two proposed solutions for this problem. The first solution is to set up a radio transceiver/receiver and antenna to transmit the data to another location with internet access. From the receiving location, the data would be sent to NREL. The alternative to this is to install an ethernet jack on the library roof, and transmit the information directly from SoRMS. This solution is the preferred solution, as it involves less variables to slow down relaying data.
Funding Required
[edit | edit source]Because this project is maintained by volunteers, and the continuous operation is powered by solar panels, the only funding required is to cover the costs of shipping the PSPs to NREL for recalibration, which is done about every two years. However, the system exists today only because of the initial support of the HSU Sponsored Programs Foundation, the National Renewable Energy Laboratory, Redwood Alliance, Schatz Energy Research Center, HSU's Environmental Resources Engineering department, HSU Plant Operations, Marty Reed - HSU Equipment Technician, and the HSU library staff.[1]
References
[edit | edit source]- ↑ 1.0 1.1 1.2 *Renewable Energy Student Union. Accessed online Oct. 2009.
- ↑ *Eppley Precision Spectral Pyranometer. Accessed online Nov. 2009. http://solardat.uoregon.edu/EppleyPSP.html
- ↑ *UVB-1/UVA-1 Ultraviolet Pyanometer. Accessed online Nov. 2009. http://web.archive.org/web/20181112134626/http://yesinc.com:80/products/data/uvb1/
- ↑ 4.0 4.1 *Apple, James and Bohn, Juliette (2008). Solar Radiation Monitoring Station (SoRMS) Operation and Maintenance Manual.
- ↑ *National Renewable Energy Laboratory: HSU Data. Accessed online Nov. 2009. http://www.nrel.gov/midc/hsu/
- ↑ 6.0 6.1 *Parker, Aaron of RESU, Personal Communication, Nov. 2009
- ↑ *Apple, James of RESU, Personal Communication, Oct.-Dec. 09
| Authors | |
|---|---|
| License | CC-BY-SA-3.0 |
| Organizations | Cal Poly Humboldt |
| Cite as | Tme21, Ccs31, BethEschenbach (2009–2025). "HEIF Solar Monitoring System". Appropedia. Retrieved July 24, 2026. |