- Download Ocean View software from the following link:
https://www.oceaninsight.com/support/software-downloads/oceanview-2.0.10-downloads-nolm/
- Install the software
- Run Ocean View application from the Application
- After you install OceanView, attach your spectrometer to the computer.
- After this, the “Windows Found New Hardware” wizard will open.
- BUT may not find the device driver. If it does not find the driver, please follow this procedure.
- Go to the Device Manager and find the “Ocean Optics spectrometer” (it should be under the category “Other Devices”).
- Right-click on “Ocean Optics spectrometer” and select 'Update Driver Software.' You will get a choice of finding the driver automatically or 'Browse My Computer.'
- Select Browse and then browse to the following directory: 'C:\Program Files\Ocean Optics\OceanView\SystemFiles.' Please be sure to select the 'SystemFiles' directory, and not the subfolder.
- After you select the 'SystemFiles' directory, click 'OK' and then 'Next' and you may get a message that 'Windows cannot verify the publisher.'
- Click on 'Install Anyway' and the device driver installation will begin.
- It should display 'Your hardware was installed successfully' when finished.
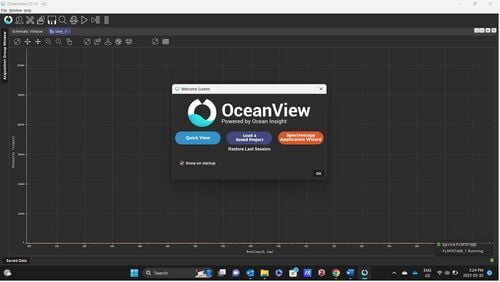
For absolute irradiance
- Select the category (measurement) that is intended - select absolute irradiance
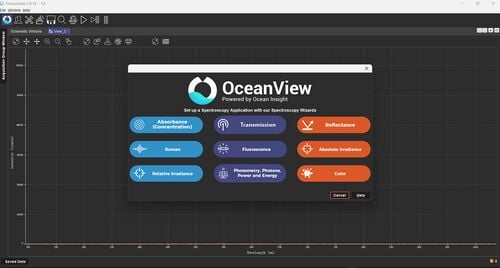
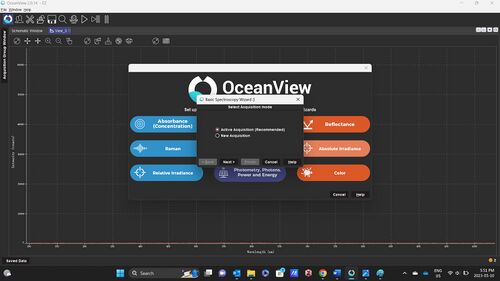
- Select "Active Acquisition" and click next
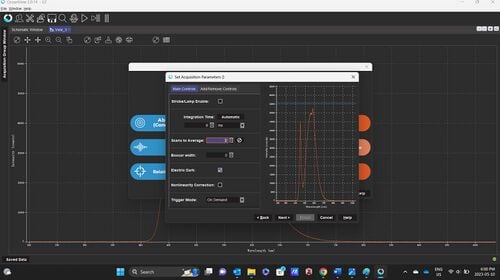
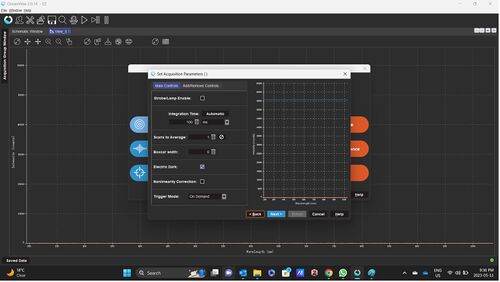
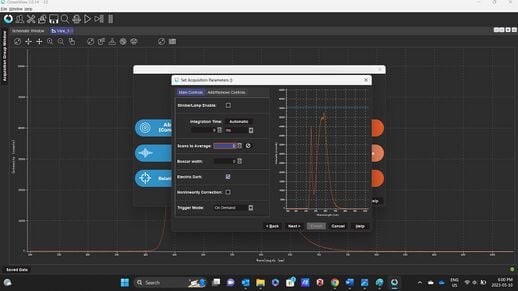
- In the next window shown below, mark integration timesuch that the highest peak of the measurement is near (but not above) the blue line. As you increase the integration time (time for a single measurement), the peak will start to approach the blue line. So the spectrometer measures the intensity by storing the photons in "buckets" - as you increase the integration time, the "bucket" fills more and more and hence intensity increases and approaches the blue line. Scans to average is the number of readings that the sensor takes for a single measurement - so if you select 2 as scans to average value and suppose the integraiton time is 1 second, the spectrometer will take 2 seconds (1second + 1 second) to form a single reading.Keep the remaining settings as default and click Next.
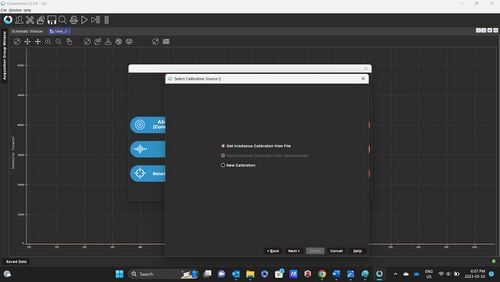
- Select "Get Irradiance Calibration" from window and click Next
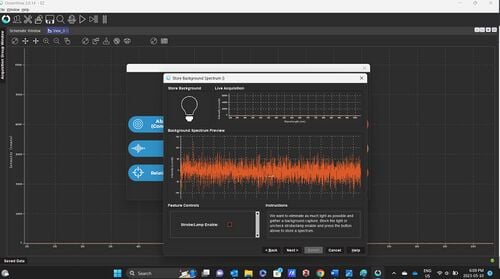
- Place the optical fibre or the cosine corrector across a black surface (can be a black cloth) and click the "Bulb Picture" as shown in the below window and click next.
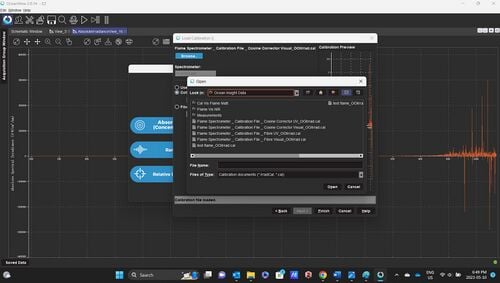
- Click Browse and select the calibration file. There are four calibration files which can be downloaded from https://osf.io/dpxjs/
- Flame Spectrometer _ Calibration File _ Cosine Corrector UV_OOIIrrad - If the spectrum is to be measured is within the UV range and you are using cosine corrector
- Flame Spectrometer _ Calibration File _ Cosine Corrector Visual_OOIIrrad- If the spectrum is to be measured is within the visual range and you are using cosine corrector
- Flame Spectrometer _ Calibration File _ Fibre UV_OOIIrrad - If the spectrum is to be measured is within the UV range and you are not using cosine corrector
- Flame Spectrometer _ Calibration File _ Fibre Visual_OOIIrrad - If the spectrum is to be measured is within the visual range and you are not using cosine corrector
- Next click finish - the spectrum now shows the active reading.
For abosrbance
- Select the category (measurement) that is intended - select absorbance
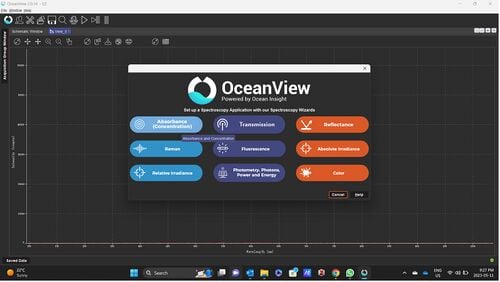
- Select "absorbance only" and click next
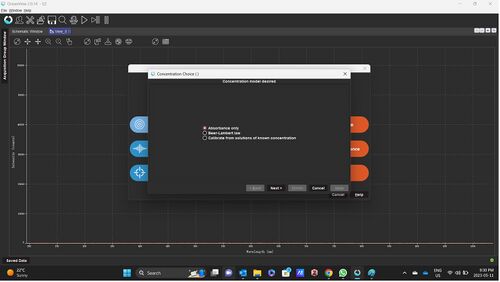
- With the light source turned on, without the sample inside, adjust integration time and scans to average as mentioned above in the absolute irradiance section and click next
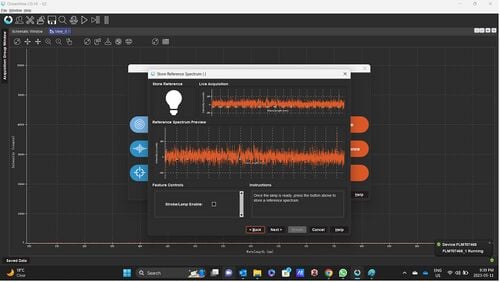
- Without the sample being tested and the light source turned on, store the reference spectrum by clicking the "Bulb Picture" and then click next
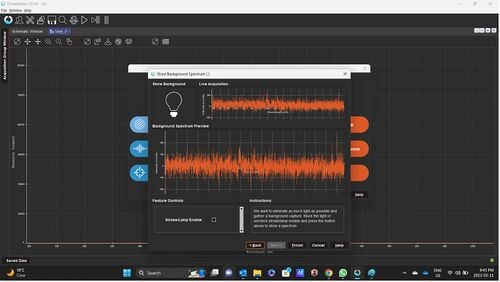
- Turn the light off and store background spectrum by clicking the "Bulb Picture" and then click next. Alternatively, place either the spectrometer input port or fibre optic against a black cloth or surface and store background spectrum
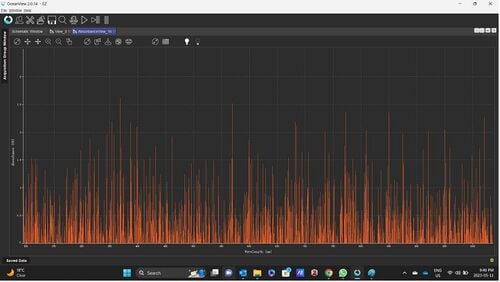
- Place the sample inside, turn on the light and the window shows the absorbance spectrum for the sample
For PAR Measurement
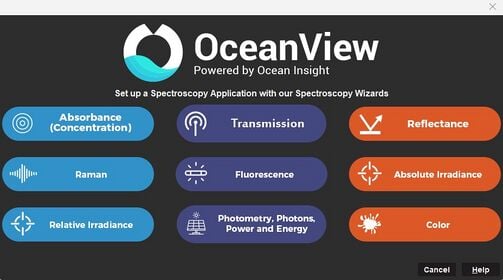
- Select the category (measurement) that is intended - select photometry, photons, power and energy
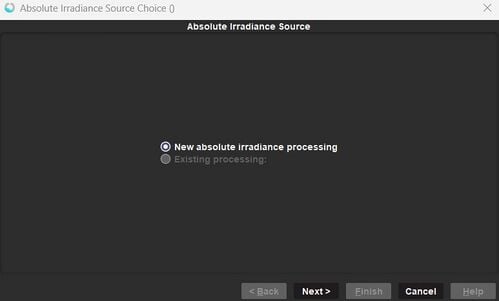
- Select "new absolute irradiance processing" and click next
- In the next window, adjust integration time and scans to average as mentioned above in the absolute irradiance section and click next
- Select "Get Irradiance Calibration" from window and click Next
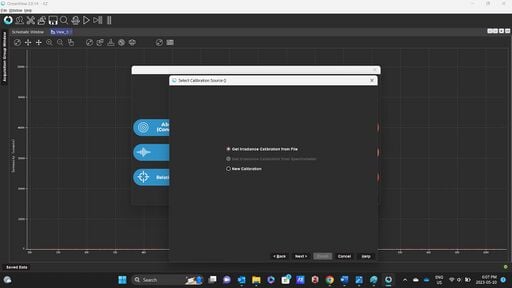
- Place the optical fibre or the cosine corrector across a black surface (can be a black cloth) and click the "Bulb Picture" as shown in the below window and click next.

- Click Browse and select the calibration file.

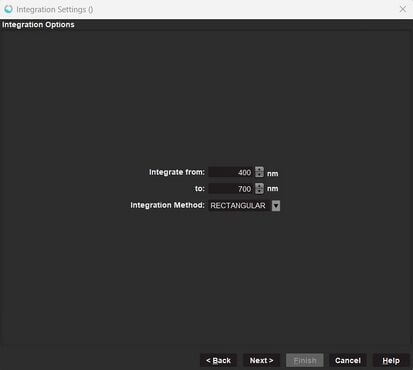
- Leave integration setting at default - Integrate from 400nm to 700nm for PAR; Integration Method: Rectangular
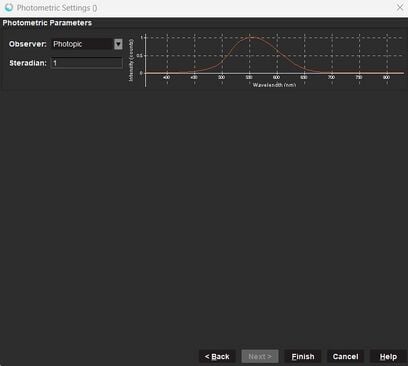
- Leave the photometric parameters at default - Observer: Photopic and Steradian: 1; then click finish to see the PAR values in the form of table
Important Notes
- The spectrometer has been calibrated till 900nm range and there will be noise above that. So increase averaging and boxcar width to bring down the noise.
- Cosine Corrector Area = 0.11945cm2
