Solar energy is one of the most important sources of energy on earth, available to us in a number of derivatives. Plant matter for example, which relies on solar energy for nutrition, experiences natural compression and decomposition over millions of years to form the the fossil fuels we use today for electrical generation and transportation. Other examples of this can be seen in use of biomass for fuel or the harvesting of wind energy which is reliant on solar heated air for the formation of currents.
We are also able to utilize the solar resource directly. Solar thermal technologies take advantage of this resource to heat a working fluid that can transfer energy to an air stream or water for domestic or commercial use. Solar Photovoltaic or PV devices exploit various materials (principally Silicon) that experience sub-atomic variations when exposed to solar energy in order to induce an electric current. Both solar PV and thermal technologies provide a useful source of energy with little to no moving parts, no pollution and very little embodied energy.
In order to effectively design a solar energy system, an understanding of the available solar resource at the location of interest is required. This article aims to provide readers with an understanding of the earth's solar resource and introduces the tools required to perform a basic analysis. A brief overview of solar radiation measurement techniques and performance modeling will also be provided.
The Sun[edit | edit source]
All of the energy available on Earth is derived from the sun. We can model the sun's surface as blackbody. At a specific temperature, approximately 5777K for the sun, a blackbody emits energy with a unique radiation spectrum (Table 1).
| Ultraviolet | Visible | Infrared | |
|---|---|---|---|
| Wavelength (m) | 0 - 0.38 | 0.38 - 0.78 | 0.78 - Inf |
| Fraction in Range | 0.064 | 0.480 | 0.456 |
| Energy in Range (W/m2) | 87 | 656 | 623 |
The spectrum is divided into three broad ranges classified as ultraviolet, visible and infrared which transmit radiation at varying intensities. The highest intensities are found within the visible spectrum, peaking at a wavelength close to 0.5um. Averaged over the entire surface, the power density of the sun is found to be approximately 63 x 10 W/m2.
Earth Bound Radiation[edit | edit source]
The sun emits radiation in all directions, however only a portion of this energy is intercepted by the Earth. The intercepted radiation for any body in space is defined as follows:
Where Ho is the intercepted power density
Hsun is the power density of the sun
D is the distance between the sun and body of interest
For Earth, the distance to the sun is about 1.495 x 10¹¹m. This provides an Earth intercepted value of around 1353 W/m2.

This number is known as the Earth's solar constant and is often referred to as extra-terrestrial radiation.
Terrestrial radiation, that is radiation hitting the Earth's surface, varies widely with geographical location, local atmospheric conditions, time of day and time of year. Some regions are more suspect to variability in terrestrial radiation than others, depending on the amount of weather fluctuations experienced. For example, desert regions tend to demonstrate consistent weather patterns thereby providing relatively consistent values of terrestrial radiation.
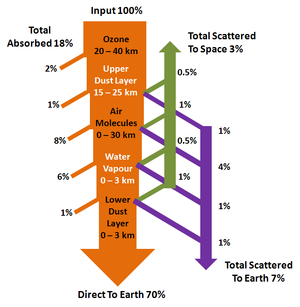
As the radiation passes through the atmosphere the following mechanism determine the amount of radiation that will reach the Earth's surface:
Absorption – Certain molecules in the atmosphere posses high photon absorption properties. For example, water vapour (H2O) and CO2 absorb far infrared radiation and ozone (O3) absorbs ultraviolet radiation. Energy that is absorbed here is unavailable for use by solar panels.
Reflection – In addition to absorption, radiation can also be reflected off of particles in the atmosphere. Radiation that is reflected a number of times before eventually reaching the Earth's surface is known as diffuse radiation. A portion of the incoming radiation may also be lost completely by reflection back into space.
No Interaction – About 70% of the incoming radiation will pass through the atmosphere undisturbed. This is known as beam or direct radiation.
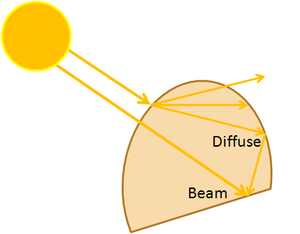
As mentioned above, radiation can reach the Earth's surface as beam/direct radiation or diffuse radiation (Figure 2). Beam radiation is defined as solar radiation that has been received from the sun without any scattering by the atmosphere. Diffuse radiation is solar radiation that has been received from the sun after its direction has been changed by scattering. Diffuse radiation is typically accounted for by adding 10% to the measured beam radiation.[3]
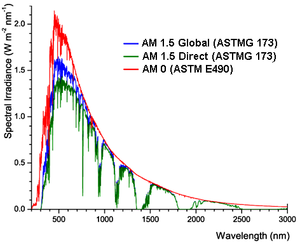
The losses due to atmospheric effects do not cause any major dips in the radiation spectrum. Rather, the impact is an overall reduction in the intensity of the entire spectrum. Depending on the time of the day, the sun's apparent position in the sky changes and as a result the length of atmosphere that the radiation must travel through also changes. When the sun is directly overhead, this length is referred to as the air mass (AM). Moving away from this overhead position, the travel distance required to hit the collecting surface increases. Figure 3 is simple schematic showing this effect.
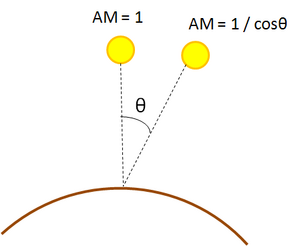
A simple calculation can be performed to quickly determine the air mass:
In order to account for the curvature of the atmosphere the following formula can be applied:
The air mass effect can also be visually understood by noting that the sun appears white (high intensity) when it is directly overhead and much redder (low intensity) during the morning and evening hours. If the air mass is known, then the resulting radiation intensity can be calculated as follows:
*where h is the height above sea level
The variability in the radiation received at the Earth's surface requires the identification of a standard to allow for fair testing and comparison of solar energy systems. This is has been defined as AM1.5 and is representative of the total radiation hitting the Earth's surface, which is found to be approximately 1000W/m2 (beam + diffuse). This value is often used to perform preliminary calculations for predicting how a system will perform. The AM1.5 spectrum is shown in Figure 4.
Accounting for the losses discussed above, the amount of energy reaching the Earth's surface every hour is still greater than the amount of energy used by the world's population in an entire year. Herein lies the motivation to design and implement solar thermal and solar PV systems.
Additional Information
Weather data will often include a measure known as the clearness indexW. This value is the ratio of received radiation on a horizontal plane to extra-terrestrial radiation based on ground and satellite measurements.
For theoretical calculations a number of sky models have been developed. The most basic model assumes that diffuse component of radiation is constant regardless of orientation. This means that all of the diffuse radiation is derived only from atmospheric scattering and equally from all directions. The Isotropic Sky model applies the same assumption but also includes diffuse radiation resulting from ground reflected radiation.
Two main phenomena, circumsolar radiation and horizon brightening, are ignored by the preceding models. Circumsolar radiation refers to the greater concentration of diffuse radiation existing in the sky immediately around the location of the sun relative to the remainder of the sky; Horizon brightening refers to the greater concentration of diffuse radiation existing on the horizon relative to the remainder of sky. These two components are accounted for in the Anistropic Sky model, however are generally not required for system performance analysis.
Describing the Sun's Location[edit | edit source]
In order to calculate the air mass, the sun's position in the sky needs to be defined. In addition, the apparent position of the sun in the sky will significantly impact the amount of radiation intercepted by our collecting surface. This section will define a number of key terms and outline how to calculate the radiation that is intercepted by a given collector; followed by an example in order to further clarify the methodology.
| Term | Definition | Diagram |
|---|---|---|
| Solar Noon | Time when the sun is directly overhead position of interest. Each hour away from this position corresponds to a 15o deviation (hour angle). | 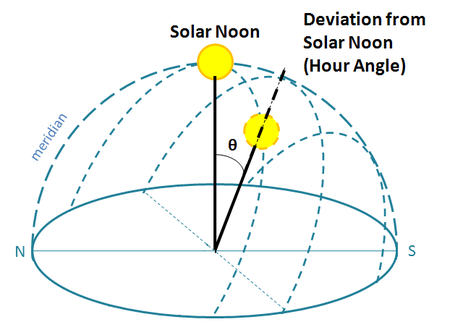 |
| Zenith Angle (θz) | The angle between the vertical and the line to the sun. This is also the angle of incidence on a horizontal surface for beam radiation. Additionally, the Solar Altitude angle is defined as the compliment of the zenith angle. | 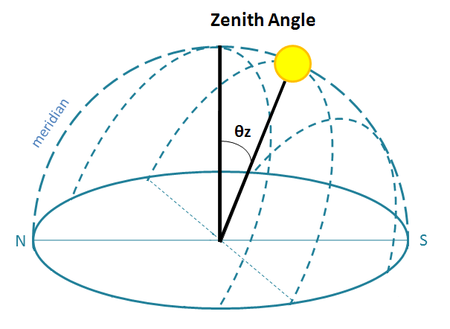 |
| Solar Azimuth Angle (γs) | The deviation angle from due South for the projection of the sun's position on the horizontal plane (-180o for Each, +180o for West) | 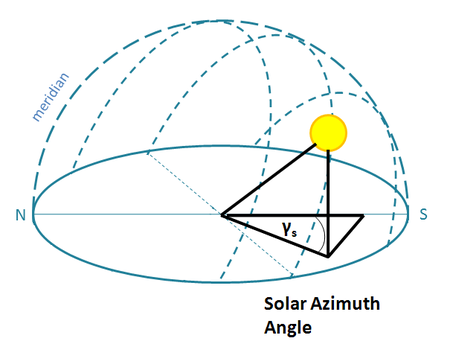 |
| Surface Azimuth Angle (γ) | The deviation angle from due South for the surface's normal vector projected onto the horizontal plane (-180o for Each, +180o for West) | 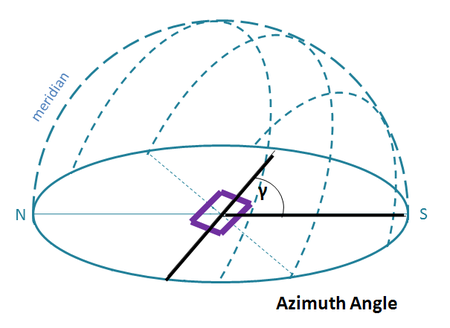 |
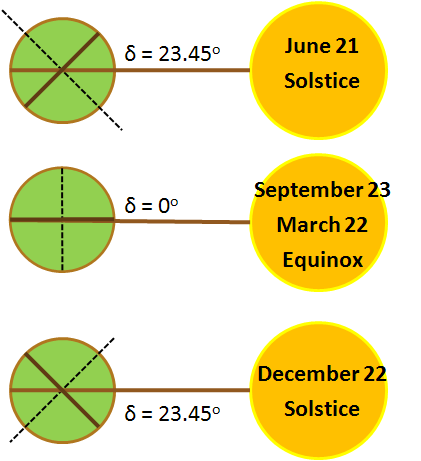
| Declination Angle (δ) | The angular position of the sun (at solar noon) with respect to the plane of the equator. The angle varies seasonally due to the Earth's tilt and can be calculated for a given day using:
δ = 23.45 sin[ 360 (284 + n) / 365 ] where n is day of the year |
 |
| Slope (β) | Angle between the collecting surface and the horizontal plane. In order to maximize the solar yield over the entire year, this angle should be set equal to the latitude. Steeper angles can be utilized to optimize for winter months. Likewise, shallow angles are used to optimize solar yield during the summer months. | 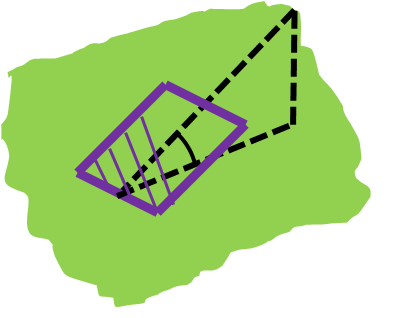 |
| Irradiance | The rate at which radiant energy is incident on a surface per unit area of surface (W/m2) | |
| Irradiation | The incident energy per unit area on a surface (integration of irradiance over a specific time J/m2 | |
| Insolation | Irradiation applied specifically to solar energy |
Calculating the Position of the Sun and Angle of Incidence[edit | edit source]
This section will outline the methodology and equations required to calculate the sun's position and the angle of incidence for a known surface at a given time and location.
Initial Calculations and known values:
Angle of Declination (δ) = 23.45 sin[ 360 (284 + n) / 365 ]
Hour Angle (ω)= (Number of Hours from Solar Noon) x 15o
Surface Azimuth (γ) = Orientation of surface measured from due South
Slope (β): Slope of surface
Latitude(Φ) of Location
Using these variables the consine of the angle of incidence of beam radiation on the surface is:
*For surfaces facing directly south/north the equation is simplified since the surface azimuth (γ) = 0o
The zenith angle (θz) can be found setting the slope (β) equal to zero in this equation. With the zenith angle found, the solar azimuth angle (γs) can be calculated as follows:
Example Calculation[edit | edit source]
Question:
Kingston, Ontario is located at 44.1oN, 76.3oW, roughly 100m above sea level. For a 4m2 collecting surface orientated directly south and tilted 45o, find the incident beam radiation at 10:30 (solar time) on February 13th.
Solution:
For the given scenario,
Angle of Declination (δ) = 23.45 sin[ 360 (284 + n) / 365 ] = - 13.95o
Hour Angle (ω) = (-2.5)(15) = - 22.5o
Surface Azimuth (γ) = 0o
Slope (β) = 45o
Latitude(Φ) = 44.1o
Applying,
cosθ = sinδ sinΦ cosβ – sinδ cosΦ sinβ cosγ + cosδ cosΦ cosβ cosω + cosδ sinΦ sinβ cosγ cosω + cosδ sinβ sinγ sinω
We get angle of incidence, θ = 25.8o
Next,
The air mass is AM = 1 / cos (-22.5) = 1.08
The incoming beam radiation is then calculated:
ID = 1.353 [ (1 - 0.14h) 0.7(AM^0.678) + 0.14h]
ID = 0.935 kW/m2(IG = 1.03 kW/m2)
Finally, for θ = 25.8o, the beam radiation intercepted by the surface is
(ID)(cosθ)(Area)
(935 W/m2) (cos25.8o) (4m2) = 3367 W
Therefore, for the given location, time and collector orientation the total intercepted radiation is 3367 W. The actual energy utilized however will depend on various collector parameters and system conditions.
Shading Considerations[edit | edit source]
Shading can be caused by nearby obstructions such as buildings, overhangs or other collectors in an array. This can have a drastic impact on system performance, particularly for solar PV panels and it is therefore important to consider when and for how long shading will occur and determine if it is avoidable through design measures.
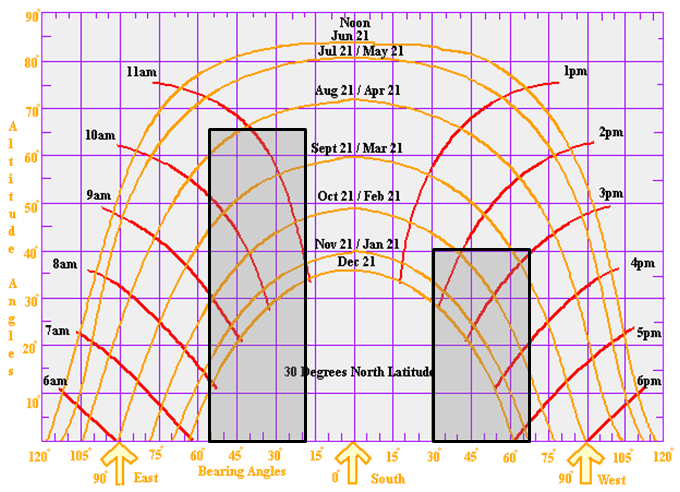
Obstructions can have irregular geometries and be located anywhere in relation to collector surface. By calculating their relative azimuth and altitude angles, a shading profile can be established by overlaying this information onto a solar chart (a solar chart is a graph used to plot the sun's position throughout the year for a given latitude). Figure 5 provides an example of theoretical solar chart and shading profile, where the darkened areas represent when shading will occur. For example, we can read off the chart that the collector will be shaded on October and February 21st between 9:30am and 11:30am and between 2:00pm and 4:30pm.
Measuring Solar Resource[edit | edit source]
In addition to providing important meteorological data, measuring solar radiation provides valuable data sets that can be used for modeling and feasibility studies. In field testing of panels also requires accurate monitoring of radiation values. There are three main types of measurement devices:[7]
- PyrheliometersW
- Measures beam radiation by targeting a small portion of the sky around the sun
- Typically induce a temperature fluctuation onto an enclosed target
- Requires tracking of the sun
- PyranometersW
- Measures beam + diffuse radiation (or diffuse only) using a semi-spherical chamber
- Device typically operates by utilizing thermopile circuit across selective surfaces
- Number of models available offering varying degrees of accuracy
- PV detectors
- Spectrally responsive detector
- Calibration constants available to account for remaining spectrum, however these are unreliable due to variations in actual spectral distribution
- Relatively Inexpensive
A more comprehensive review of solar radiation measurement devices and techniques can be found here.
For all radiation measurement devices, a number of factors determines the overall quality and accuracy of retrieved data:
- Glass Layer
- For devices that require an external glass layer, the uniformity of the thickness in this layer is extremely important to avoid refractive effects. The glass should have very low reflective properties.
- Moisture Content
- Any moisture within the measurement zone can skew the incoming radiation via reflection and refraction. In addition to proper sealing a number of devices use a replaceable solid desiccant to ensure dry conditions inside the device.
- Temperature Sensitivity
- The response of the circuitry used to output data can vary with temperature fluctuations induced by exposure to radiation and ambient temperature changes. It is difficult to thermally isolate these circuits, however a number of devices use multiple junctions or temperature compensation factors to minimize this effect.
- Orientation
- The semi-spherical chamber used in pyranometers does not maintain a perfect vacuum. As a result, if the device is used to measure radiation on a tilt angle, the heated air inside the chamber can form convective currents which can induce further issues associated with temperature sensitivity and radiation interference.
- Degradation
- All measurement device degrade over time. It is recommended that calibration constants for be re-evaluated every few years to ensure accurate readings.
In addition to ground-based measurements, data can also be inferred from satellite observations of the atmosphere. NASA provides monthly radiation data sets for a number of locations across the globe using meteorological data and satellite observations. This data provides a convenient source for performing preliminary feasibility studies, however should only be used if ground-based data is not available.[8] Table 3 highlights the uncertainties associated with measured radiation data.
| Data Source | Uncertainty |
|---|---|
| NASA Data Set | 7 - 12% |
| Ground-Measured | 6 - 12% |
| Ground-Measured by High Quality Research Sites | 3 - 6% |
Simulating Performance[edit | edit source]
Modelling provides a tangible way of predicting performance for a variety of system configurations and environmental conditions. To verify a models validity, a number of well defined scenarios are simulated and compared to experimental data. If the simulated results are adequately close to the experimental results, the model is validated to a specific degree of accuracy based on the data differential. Alternatively, newly developed models are often validated against existing models which have already been validated.
A number of simulation tools are available to model various system configurations. The most basic simulation program must provide inputs for radiation data, collector characteristics and collector orientation; and perform monthly,daily or yearly calculations similar to what has been demonstrated in the example provided earlier.
Beyond these inputs, a number of simulation tools provide additional inputs to better define the system being modeled. Inverter characteristics, battery information, pump characteristics, wiring information, piping information, system energy demand, energy prices, and wind conditions are some examples of inputs that would provide greater flexibility and detail. Some tools are also streamlined to specifically simulate a small range of system types and provide easy to use outputs.
A list of PV simulation tools and a general description can be found here. The simulation tool RETScreen is discussed in further detail below.
RETScreen[edit | edit source]
RETScreen is a free renewable energy technology analysis tool (solar, wind, biomass, hydro, etc.) developed by CanmetEnergy of Natural Resources Canada in collaboration with a number of other government and multi-lateral organizations.
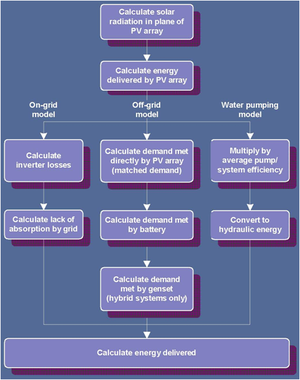
The program works as a plug-in for Microsoft Excel 2000 or higher and includes a built in monthly radiation database from NASA. Simulations can performed for a variety of PV panel types (a-Si, c-Si, etc.) and allows the user to select one of three system types: On-Grid, Off-Grid or Water Pumping model. Figure 6[10] shows the data processing schematic for each type.
In addition to calculating energy production and emissions reduction, RETScreen also accepts inputs for electricity, system component, labor and maintenance costs. Utilizing these inputs and user defined inflation and interest rates and leveraged percentage, the simulation provides an analysis to determine the its financial viability.
Limitations
While RETScreen is a useful tool for system analysis it is subject to a number of limitation listed below.
Inherent to Program:
- Currently cannot model concentrator systems
- Cannot adequately customize system configuration
- Cannot compare configurations
- Only provides option to use monthly averaged radiation data (cannot utilize higher resolution ground-measured data)
- Does not provide reliability measure (loss of load probability)
User Controlled:
- Financial analysis easy to manipulate for ideal findings
Given the above limitations, RETScreen remains a valuable tools for preliminary feasibility studies. Findings, however, should be presented with a sensitivity analysis in order to provide some insight to the variability in performance and cost recovery. Once project specifications are known in greater detail, RETScreen results should be complimented with more detailed analysis tailored specifically to the proposed project in order to account for hourly radiation fluctuations, shading, etc.
Additional Resources[edit | edit source]
The PVCDROM is an online educational tool developed by Stuart Bowden and Christiana Honsberg who work at the Solar Power Labs at Arizona State University. The content includes solar energy fundamentals and information on photovoltaic technology.
CanmetEnergy is subsidiary of Natural Resources Canada. Their website hosts information on renewable technologies, including solar PV and solar thermal technologies.
The Appropedia page photovoltaics provides a technical overview of all the components in a solar PV system.
The Solar Photovoltaic Open Lectures is a series of five fully annotated slide presentations created for the solar energy community to assist in the dissemination of information about solar photovoltaic (PV) cells.
Satellite Data[edit | edit source]
Hourly data[edit | edit source]
- Canadian Satellite: ftp://ftp.nrcan.gc.ca/energy/SOLAR/WesternCanada_2002_2007/
- American satellite: http://web.archive.org/web/20161003104710/http://maps.nrel.gov:80/prospector
- Europe : http://www.soda-is.com/eng/services/services_radiation_free_eng.php and http://www.satel-light.com
Daily data[edit | edit source]
- Daily NASA SSE: http://web.archive.org/web/20170714113809/https://eosweb.larc.nasa.gov/cgi-bin/sse/sse.cgi?skip@larc.nasa.gov+s01
See also[edit | edit source]
References[edit | edit source]
- ↑ Duffie J. A., Beckman W. A., Solar Engineering of Thermal Processes, pp7, John Wiley & Sons Inc, 2006
- ↑ Hu, C. and White, R.M., "Solar Cells: From Basic to Advanced Systems", McGraw-Hill, New York, 1983
- ↑ 3.0 3.1 3.2 Honsberg C., Bowden S., Photovoltaics DROM, Properties of Sunlight, http://pvcdrom.pveducation.org/index
- ↑ Duffie J. A., Beckman W. A., Solar Engineering of Thermal Processes, pp13, John Wiley & Sons Inc, 2006
- ↑ Duffie J. A., Beckman W. A., Solar Engineering of Thermal Processes, pp14, John Wiley & Sons Inc, 2006
- ↑ Duffie J. A., Beckman W. A., Solar Engineering of Thermal Processes, pp16, John Wiley & Sons Inc, 2006
- ↑ Duffie J. A., Beckman W. A., Solar Engineering of Thermal Processes, pp44-49, John Wiley & Sons Inc, 2006
- ↑ Stackhouse W. P., Whitlock C. H., Surface meteorology and Solar Energy – Accuracy, NASA, 2010, http://web.archive.org/web/20151105102935/https://eosweb.larc.nasa.gov/cgi-bin/sse/sse.cgi?+s05
- ↑ Stackhouse W. P., Whitlock C. H., NASA Derived and Validated Climate Data for RETScreen Use: Description and Access, NASA Langley Research Center, 2008, www.RETScreen.net/fichier.php/1365/NASA_Data.ppt
- ↑ Natural Resources Canada, Photovoltaic Project Analysis, RETScreen International, 2010, http://www.retscreen.net/ang/course_pv.html

