Differential scanning calorimetry experiments were conducted to analyze the thermal stability and characteristics of various proteins.
Safety Training Requirements[edit | edit source]
- Dr. Pearce Safety Lab Tour
- Worker Health & Safety Awareness
- WHMIS 2015 - Workplace Hazardous Materials Information System
- Laboratory Safety & Hazardous Waste Management
- Surface Science Western Safety Protocols
Safety Issues with DSC[edit | edit source]
Potential for burns due to the heated cells of the instrument.
- Ensure the measuring cell has cooled down before interacting with the sample or furnace.
- Do not touch the furnace following an experiment. Instead, use tweezers to remove any necessary parts.
Personal Protective Equipment[edit | edit source]
PPE is to keep YOU safe so that you can keep doing what you want to do.
- Safety glasses – always required
- Approved gloves
- Labratory Coat
SDS[edit | edit source]
Knowing what chemicals are in the lab and how they interact with each other is critical when accidents happen.
- Appropriate SDS sheets should be viewed online.
- Note the hazards listed on the door to the lab. If you introduce any new equipment or materials you must clear them with the responsible person listed on the lab door. If the responsible person is out of date, contact the departmental administrators to get it updated.
DSC Equipment[edit | edit source]
- Instrument: Mettler Toledo DSC 3
- Located at Surface Science Western, 999 Collip Circle, London ON
- DSC Surface Science Western
System Capabilities:[1]
- Temperature range: −100 to 700 °C
- Atmosphere: nitrogen or oxygen gas
- Heating rate: 0.02 to 300 °C/min
- Cooling rate: 0.02 to 50 °C/min
- Further specifications can be found in the product brochure
Tolerances[edit | edit source]
- Temperature accuracy: ±0.2 K
- Temperature precision: ±0.02K
- Sampling rate: Maximum 50 values/second
Calibration[edit | edit source]
The accompanying software for the DSC 3 is equipped with features that perform calibrations and adjustments, including:[2]
- Cell temperature calibration through evaluating onset melting cell temperature at 1+ heating rates
- Heat flow and tau lag calibrations through evaluating melting enthalpy at 1+ heating rates
The general calibration technique is as follows:[2]
- Select calibration method and insert reference sample; follow method details
- Prepare the test sample and input into the measuring cell
- Start the measurement
- View calibration results and confirmation in the Module Control Window of the software
- Remove samples once the furnace temperature has cooled
Operation & Procedure[edit | edit source]
The below DSC operation information was extracted from the Mettler Toledo DSC 3 user manual.[2]
Preparing the DSC Module and Sample for Experiment[edit | edit source]
- Ensure the DSC cell, furnace, and other parts are clean.
- Set the purge gas flow rate.
- 30 mL/min or 50 mL/min
- Hermetically seal the aluminum reference pan (reference crucible)
- Using tweezers, remove the furnace lid and insert the reference pan into the crucible onto the refence sensor.
- Reference sensor is labeled "R".
- Using tweezers, place the furnace lid back on.
- Weigh 10-15 mg of the sample and place into aluminum sample pan (sample crucible); seal the pan.
Conducting Experiment[edit | edit source]
- Select the experimental temperature range and heating rate.
- Set up the experimental conditions in the accompanying software and establish connection.
- Turn on the DSC by toggling the switch.
- Send the experiment to the Module Control Window of the software, and click "Start" on the Module Control Window.
- Wait for the measuring cell to reach the desired insertion temperature.
- Using tweezers, remove the furnace lid and place on the lid support, as it may be hot.
- Using tweezers, insert the sample pan into the crucible onto the sample sensor.
- Sample sensor is labeled "S".
- Using tweezers, place the furnace lid back on.
- Click "OK" on the Module Control Window to start the experiment.
- The DSC module will track heatflow and temperature from the start temperature to the end temperature, increasing by the heating rate.
- The DSC will eventually hit a removal temperature after reaching the end temperature.
- Once the removal temperature has been reached, remove the furnace lid with tweezers and place on the lid support.
- Using tweezers, remove the sample pan and place on the crucible tray.
- Click "OK" in the Module Control Window of the software to terminate the experiment.
- Obtain the run data from the software.
Shutdown[edit | edit source]
The below DSC shutdown information was extracted from the Mettler Toledo DSC 3 user manual.[2]
- Using tweezers, remove the reference pan.
- Using tweezers, place the furnace lid back on.
- Turn off the DSC module by toggling the switch.
- Power down the software.
Interpreting Results[edit | edit source]

Surface Science Western outputs the DSC Module results in a text file, which includes the sample time [s], heatflow [W/g], sample temperature Ts [ºC], and reference temperature Tr [ºC]. The DSC run data can be used to graph the heatflow versus sample temperature to make a DSC curve.
Thermal Effects[edit | edit source]
Endothermic Curves[edit | edit source]
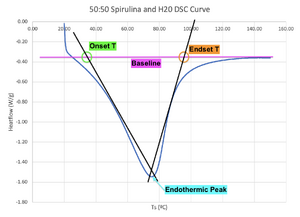
DSC curves can be used to gauge thermal stability. Deviations from the baseline signify thermal effects. The baseline is defined as the signal expected if no transition event occurs.[3] It is important to note that the baseline does not have to be a flat line, as the specific heat capacity of a substance changes with temperature.[3] Figure 2 illustrates the approximate baseline as a pink line.
The onset temperature can be interpreted as the start of denaturation (melting) transition.[3] Figure 2 displays the onset temperature at the point where the tangent line of the first length of the peak intersects the baseline.[3]

The endset temperature can be interpreted as the end of denaturation (melting) transition.[3] Figure 2 displays the endset temperature at the point where the tangent line of the second length of the peak intersects the baseline.[3]
Figure 2 exhibits an endothermic peak where the 2 tangent lines cross.[3] An endothermic peak is considered a melting peak if the sample weight does not greatly decrease over the heating range, and if the sample has visibly melted after the heating range (among other factors).[4] In melting, the endothermic peak temperature is equivalent to the denaturation temperature.[5] The higher the denaturation tempearture, the more thermally stable the sample is since a larger amount of heat is required to break the bonds in the sample.[5]
The area under the DSC curve can also provide an estimation for enthalpy[6]:
ΔH = K * ∫Tdt = K * A
Where H is enthalpy, K is the calorimetric constant (which depends on the sample), T is sample temperature, t is the sample time, and A is the area under the DSC curve.[6]
Exothermic Curves[edit | edit source]
The above is for endothermic (melting) curves. Similar analysis can be used for exothermic (crystallization) curves, which have upward pointing peaks.[3]
Unexpected Transitions in Curves[edit | edit source]
Due to the myriad of effects temperature has on substances, DSC curves may differ from the typical form. Unexpected transitions encountered by FAST are described below.
Large Endothermic Start-up Hook[edit | edit source]

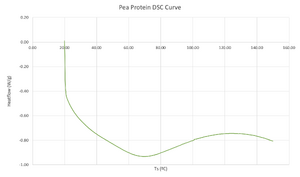
Figure 3 demonstrates a fairly large "start-up hook" on the DSC curve. This delay can be attributed to the difference in heat capacity between the pea protein sample and the reference.[7] This large declining baseline hinders the detection of weak peaks.[7] Literature reports pea protein DSC curves to have 2 endothermic peaks due to the different compounds present in pea protein, which is not exhibited in figure 3.[5]
References[edit | edit source]
- ↑ https://www.surfacesciencewestern.com/analytical-services/differential-scanning-calorimetry-dsc/
- ↑ 2.0 2.1 2.2 2.3 https://www.mt.com/ca/en/home/library/user-manuals/lab-analytical-instruments/ta-manuals.html
- ↑ 3.0 3.1 3.2 3.3 3.4 3.5 3.6 3.7 https://www.mrl.ucsb.edu/sites/default/files/mrl_docs/instruments/Interpreting%20DSC%20Data%20v1A.pdf
- ↑ https://www.eng.uc.edu/~beaucag/Classes/Characterization/DSCParts/Artifacts%20in%20DSC%20Usercom_11.pdf
- ↑ 5.0 5.1 5.2 Y. Ladjal-Ettoumi, H. Boudries, M. Chibane, and A. Romero, "Pea, chickpea and lentil protein isolates: Physicochemical characterization and emulsifying properties - food biophysics," SpringerLink, 07-Aug-2015. [Online]. Available: https://link.springer.com/article/10.1007/s11483-015-9411-6. [Accessed: 26-Aug-2022].
- ↑ 6.0 6.1 X. Sun, C. Li, Y. Chu, M. A. Medina, and K. O. Lee, "Melting temperature and enthalpy variations of phase change materials (pcms): A differential scanning calorimetry (DSC) analysis," Taylor & Francis, 09-May-2018. [Online]. Available: https://www.tandfonline.com/doi/abs/10.1080/01411594.2018.1469019?needAccess=true&journalCode=gpht20. [Accessed: 26-Aug-2022].
- ↑ 7.0 7.1 http://www.tainstruments.com/pdf/literature/TA039.pdf
