
HSU mason jar analysis

| Type | |
|---|---|
| Authors | Lonny Grafman |
| Status | |
| Years | 2016 |
| Made | Yes |
| Tools | Mason jars |
This page is the compilation of a research project in partnership between Engr308 Technology and the Environment, The Sustainability Office, and Dining Services at Cal Poly Humboldt during Fall 2016. The client leads on this project are
- Morgan King, Sustainability & Waste Coordinator
- Katie Koscielak, Sustainability Analyst
- Ron Rudebock, Director of Dining Services
The objective of this project is to analyze and compare the effects of the HSU policy and pricing regarding mason jars and disposables in terms of its monetary costs, carbon dioxide emissions, and embedded energy. A secondary goal is to create a recommendation that would improve the overall functionality of the policy. Another goal was to create compelling comparisons for consumers.
Findings
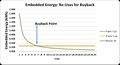
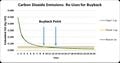
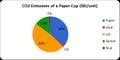
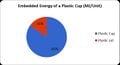
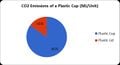
[edit | edit source]This study of Mason jars, paper cups, and plastic cups compared three metrics: carbon dioxide emissions, embedded energy, and cost. It was concluded that the materials used, transport of, and disposal of a single mason jar requires 1.7 kilowatt-hours of energy, is responsible for 0.47 pounds of carbon dioxide emissions, and are sold for $0.75. In comparison, a single paper cup is responsible for using 0.261 kilowatt-hours of energy, releasing 0.052 kilograms of carbon dioxide, and costs $1.00. A single plastic cup is responsible for using 0.270 kilowatt-hours of energy, releasing 0.034 kilograms of carbon dioxide emissions, and costs $1.50. In order to abate the embedded energy and carbon dioxide emissions incorporated in a Mason jar, the Mason jar must be reused 7 times (energy) and 9 times (carbon dioxide), rather than purchase and dispose of a paper cup. As for the plastic cup, a mason jar must be reused 6 times (energy) and 14 times (carbon dioxide).
-
 Embedded energy in the production of a single Mason jar by source as produced by Mason Jar Analysis.
 -
 Embedded energy in the production of a single Mason jar by source as produced by Mason Jar Analysis.


| Mason Jar | Paper Cup | Plastic Cup | |
|---|---|---|---|
| Embedded Energy (kWh/unit) | 1.7 | 0.261 | 0.270 |
| Carbon Dioxide (kg/unit) | 0.469 | 0.052 | 0.034 |
| Mason Jar Reuses
(Embedded Energy) |
n/a | 7 | 6 |
| Mason Jar Reuses
(Carbon Dioxide) |
n/a | 9 | 14 |
The calculations and assumptions used to obtain these results can be seen in further detail in the following spreadsheet: Download Mason Jar Analysis.xlsx
The spreadsheet allows for others interested in performing a similar analysis to easily input values pertaining to their particular study area. It is our hope that with this information and the pre-assembled spreadsheet, other institutions will be able to reach similar compelling conclusions that have the potential to influence future policies.
Mason Jars
[edit | edit source]The Mason jars analyzed in this study were the 16 oz wide-mouth glass jars with a steel ring and rubber sealed, stainless steel lid. The jars were produced by the company Jarden Home Brands based out of Fishers, Indiana, and were transported to Cal Poly Humboldt in Arcata, California. The jars are purchased by the pallet for $0.59 per jar, and are sold for $0.75 each, generating a profit of $0.16 per jar. It was estimated that about 2% of all the jars purchased were thrown out, and 3% were recycled.
-
![Embedded energy in the production of a single Mason jar by source as produced by Mason Jar Analysis.]]](/w/images/thumb/3/36/EE_Mason.jpg/120px-EE_Mason.jpg) Embedded energy in the production of a single Mason jar by source as produced by Mason Jar Analysis.]]
Embedded energy in the production of a single Mason jar by source as produced by Mason Jar Analysis.]] -
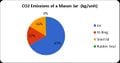 Carbon Dioxide emissions from the production of a single Mason jar by source as produced by Mason Jar Analysis.
![Embedded energy in the production of a single Mason jar by source as produced by Mason Jar Analysis.]]](/File:EE_Mason.jpg)

| Output | Embedded Energy | Carbon Dioxide Emissions |
|---|---|---|
| Materials | 1.49 kWh/jar | 0.39 kg CO2/jar |
| Transportation | 0.19 kWh/jar | 0.052 kg CO2/jar |
| Disposal | 0.0055 kWh/jar | 0.028 kg CO2/jar |
| Total | 1.7 kWh/jar | 0.47 CO2/jar |
Paper Cups
[edit | edit source]The paper cups analyzed in this study were the 16 oz disposable Karat Earth "ONE Earth" cups. These cups were produced by the company LolliCup based out of Chino, California, and were transported to Cal Poly Humboldt in Arcata, California. The cups are purchased by the pallet for $0.08 per cup, and are sold for $1.00 each, generating a profit of $0.92 per cup. It was estimated that 100% of all the paper cups purchased were thrown out.
-
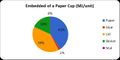 Embedded energy in the production of a single disposable paper cup by source as produced by Mason Jar Analysis.
 -
 Carbon Dioxide emissions from the production of a single disposable paper cup by source as produced by Mason Jar Analysis.


| Output | Embedded Energy | Carbon Dioxide Emissions |
|---|---|---|
| Materials | 0.25 kWh/cup | 0.05 kg CO2/cup |
| Transportation | 0.0026 kWh/cup | 0.001 kg CO2/cup |
| Disposal | 0.008 kWh/cup | 0.002 kg CO2/cup |
| Total | 0.26 kWh/cup | 0.052 CO2/cup |
Plastic Cups
[edit | edit source]The plastic cups analyzed in this study were the 16 oz disposable Karat Earth PLA eco-friendly cups. The cups were produced by the company LolliCup based out of Chino, California, and were transported to Cal Poly Humboldt in Arcata, California. The cups are purchased by the pallet for $0.12 per cup, and are sold for $1.50 each, generating a profit of $1.38 per cup. It was estimated that 100% of all the plastic cups purchased were thrown out.
-
 Embedded energy in the production of a single disposable plastic cup by source as produced by Mason Jar Analysis.
 -
 Carbon Dioxide emissions from the production of a single disposable plastic cup by source as produced by Mason Jar Analysis.


| Output | Embedded Energy | Carbon Dioxide Emissions |
|---|---|---|
| Materials | 0.26 kWh/cup | 0.031 kg CO2/cup |
| Transportation | 0.0045 kWh/cup | 0.001 kg CO2/cup |
| Disposal | 0.006 kWh/cup | 0.002 kg CO2/cup |
| Total | 0.270 kWh/cup | 0.034 CO2/cup |
Impacts
[edit | edit source]Based off the calculations made above for the embedded energy, CO2 emissions, and costs relating to each beverage container, various impacts on the HSU campus can be made.
On a typical work day at HSU (Monday through Friday), it can be assumed that:
- Mason jars: 75 jars sold
- Paper cups: 100 cups sold
- Plastic cups: 75 cups sold
- Re-Usable Containers: 500 drinks sold
Given that there are 146 work days in a year, the impacts below can be calculated:
| Total Sold | Embedded Energy | CO2 Emissions | |
|---|---|---|---|
| Mason Jar | 10,950 jars | 18,558 kWh | 5,132 kg |
| Paper Cups | 14,600 cups | 3,806 kWh | 754 kg |
| Plastic Cups | 10,950 cups | 2,961 kWh | 375 kg |
In terms of the savings from the 500 refills, and assuming that the same ratio of paper and cups sold are now being avoided in those reusable refills, it can be said that:
| Total Saved | Embedded Energy Savings | CO2 Emissions Avoided | |
|---|---|---|---|
| Paper Cups | 41,714 cups | 10,875 kWh | 2,154 kg |
| Plastic Cups | 31,286 cups | 8,460 kWh | 1,070 kg |
| Total | 73,000 cups | 19,335 kWh | 3,224 kg |
The cost of 500 Mason jars equates to 847 kWh of embedded energy, and 234 kg CO2 emissions.
In total, this presents a savings of 18,488 kWh of energy, and 2,990 kg of CO2 avoided.
In addition, the value of 19,335 kWh saved outweighs the embedded energy in all of the mason jars purchased. So even if all of those mason jars purchased were single use, the savings would outweigh their embedded energy of 18,558 kWh. The same thing is not true for the embedded CO2. That said, the mason jars are not being used just once which makes mason jar implementation much more compelling.
Comparisons
[edit | edit source]A number of comparisons have been made by each team which help understand the magnitude of the impacts of the policy change being analyzed in this report. These comparisons are represented as one or two lines of text on a relatable image, and are displayed in the gallery link below.
Research Synthesis
[edit | edit source]Embedded Energy, CO2, and Life Cycle Analysis Concepts
[edit | edit source]During the spring of 2016, Cal Poly Humboldt chose to support the Kill the Cup Campaign, a national campaign to end the use of disposable coffee cups and to promote the use of reusable cups. After the Campaign ended, Waste Reduction and Resource Awareness Program (WRRAP), Zero Waste Humboldt, and Cal Poly Humboldt's Dining services decided to sell Mason Jars as a way to promote the use of reusable cups. They are sold along side paper cups, but by reusing a mug instead of purchasing a paper cup, the coffee would costs less. This literature review, will go over the embedded energy and CO2 emissions of the individual products, the energy and carbon impact of shipping the products, and disposal of the products, as well as creating a total energy and carbon dioxide impact of the product once the product is bought.
Embodied or embedded energy (EE) is defined as the energy used during the entire life cycle of a product. For example, the EE of a mason jar or a disposable cup could include extraction and processing of raw materials, manufacturing, transportation, distribution, use, reuse, recycling and final disposal. EE calculations are used to conduct life cycle assessments (LCA). LCA is a well-explored concept and has been used as an environmental management tool since the late 1960's.[1] LCA provides a tool for evaluating the relative environmental impact of various materials and calculates externalities otherwise excluded from pricing. Our LCA will include emissions and the EE of the materials and shipping.[2]
Some background information:
- Lumberjack article on the mason jars
- Students Promoting 'Kill the Cup' Contest
- Sign from 2015 regarding single use coffee cups on campus.
Embedded Energy and CO2 Emissions in materials
[edit | edit source]Mason Jars
| Material | Embedded Energy (MJ/kg) | CO2 Emissions (kg CO2/kg) |
|---|---|---|
| Soda-Lime | 11 | .8 |
| Float Glass | 15.511 | 1.136 |
| Primary Glass | 15.00 | .86 |
| Secondary Glass | 11.50 | .55 |
| Fiberglass | 28.00 | 1.54 |
| Toughened | 23.50 | 1.27 |
"Not recycled: 8.4 kg CO2E per kilogram of glass
Recycled: 1.4 kg CO2E per kilogram of glass"[5]
Stainless steel lid: 56.7 MJ/kg (EE), 6.15 (CO2E)[6]
Paper Cups
- Paper: 25.66 (Mj/Kg), 1.29(kg CO2/kg)[7]
- Glue: EE 61.67 MJ/kg; CO2E 1.3 kgCO2/kg
- Lid (polycarbonate): EE 112.9 MJ/kg; CO2E 7.62 kgCO2/kg
- Sleeve: EE 29.97 MJ/kg; CO2E 1.29 kgCO2/kg
Plastic Cups
Polylactide Plastic: EE 54.1 (Mj/Kg); CO2E 1.8 (kg CO2/kg)[8]
Embedded Energy and CO2 Emissions in Transportation
[edit | edit source]Transport by sea[9]
- 6,000 TEU Container Ship: Embedded Energy: 0.143 MJ/t/km
- 6,000 TEU Container Ship: CO2Emissions: 11.1 g/t/km
- 1,500,000 ton bulk carrier: Embedded Energy 0.027 MJ/t/km
- 1,500,000 ton bulk carrier: CO2 Emissions 2.1 g/t/km
Transport by Land
For Trucks the Fuel efficiency of Class 8 Truck by Vehicle Weight Range on Flat Terrain at 65 mph 9.2 miles/gal[10] which we then convert into km which is 14.8 km/gal.
- For Diesel Fuel
Energy intensity: 135.8 MJ/gal[11]
Carbon Intensity 10.15 kg CO2 /gal[12]
- General embedded energy in shipping by land[13]
traveled by truck: 2.7 MJ/ t-km
Traveled by Truck: 180 (t CO2E / t-km x 10^6)
General embedded CO2 in shipping by land 80 g/tonne/km[16]
Embedded Energy and CO2 Emissions in Disposal
[edit | edit source]It was found that Cal Poly Humboldt sends it's waste to landfills at Redding, CA and at Medford, OR[17]
Humboldt State also sends their Recyclable waste to Willits, CA[18] and to Strategic Material in San Leandro, CA
The efficiency for a variety of trash trucks was averaged at 3 miles per gallon which was then converted to km instead of miles[19] which ended being 4.8 km/gal.
Diesel Energy intensity: 135.8 MJ/gal[20]
Carbon Intensity 10.15 kg CO2 /gal[21]
Next Steps
[edit | edit source]After completing the initial analysis, there are various alterations to the methods that could be made to create even more accurate results. These include:
- What are people's methods of washing the Mason jars? Is it significant enough to change the final outputs?
- How often are Mason jars actually reused compared to the number that are purchased simply due to the lower price?
- Include accurate reports of overall sales increases/decreases of Mason jars and disposables after implementation of the policy.
- Determine the volume of waste avoided by the implementation of a policy such as this.
- Calculate the embedded energy and carbon dioxide emissions in each unit produced by the manufacturing facilities, and the acquisition of the raw materials.
- Explore alternate options as to whether or not other viable products have the potential to reduce the embedded energy or carbon dioxide emissions from any of the beverage containers.
- Determine outlets for promoting and distributing this research to make it widely accessible.
- Partnership with other CSUs to strive towards waste, energy, and CO2 reduction initiatives.
Teams
[edit | edit source]TEAM 1
[edit | edit source]- Carlos Arreola, Rufus Brown, Jesus Cornejo, Nick Rasmussen
TEAM JAR-JAR BINKS
[edit | edit source]The Jarheads
[edit | edit source]FREE MASONS
[edit | edit source]Jar-Droppers
[edit | edit source]Meta Team
[edit | edit source]References
[edit | edit source]- ↑ Menzies, Gillian F., Seyhan Turan, and Philip FG Banfill. "Life-cycle assessment and embodied energy: a review."Proceedings of the Institution of Civil Engineers-Construction Materials 160.4 (2007): 135-144
- ↑ http://buildingsdatabook.eren.doe.gov/TableView.aspx?table=Notes/
- ↑ Ashby, M. (2012). Materials and the Environment - Eco-informed Material Choice.
- ↑ http://www.viking-house.co.uk/downloads/ICE%20Version%201.6a.pdf
- ↑ http://www.greenrationbook.org.uk/resources/footprints-glass
- ↑ http://www.viking-house.co.uk/downloads/ICE%20Version%201.6a.pdf
- ↑ https://www.dartcontainer.com/media/1889/ilea.pdf
- ↑ http://www.natureworksllc.com/~/media/The_Ingeo_Journey/EcoProfile_LCA/EcoProfile/NTR_CompleteLCA_EcoProfile_1102_pdf.pdf?la=en
- ↑ http://www.sname.org/HigherLogic/System/DownloadDocumentFile.ashx?DocumentFileKey=8fc28849-71a2-4f98-886f-7b5e7b8819a8
- ↑ http://cta.ornl.gov/vtmarketreport/pdf/chapter3_heavy_trucks.pdf
- ↑ https://www.extension.iastate.edu/agdm/wholefarm/pdf/c6-87.pdf
- ↑ http://www.eia.gov/tools/faqs/faq.cfm?id=307&t=11
- ↑ http://pubs.acs.org/doi/pdf/10.1021/es702969f
- ↑ http://cta.ornl.gov/data/chapter2.shtml
- ↑ http://www.dot.ca.gov/trafficops/trucks/quickguide.html
- ↑ http://www.ics-shipping.org/docs/co2,
- ↑ https://humboldtgov.org/DocumentCenter/View/4203
- ↑ http://www.northcoastjournal.com/humboldt/the-recyclable-journey/Content?oid=2166785
- ↑ http://www.cert.ucr.edu/events/pems2014/liveagenda/25sandhu.pdf
- ↑ https://www.extension.iastate.edu/agdm/wholefarm/pdf/c6-87.pdf
- ↑ http://www.eia.gov/tools/faqs/faq.cfm?id=307&t=11
| Authors | |
|---|---|
| License | CC-BY-SA-3.0 |
| Cite as | Kan324, Nsvoma7, Kelsey Summers, Lonny, Jcb290, Rcg211, Njr220, Hcp82, Mnf148, Beefish, Nitopoop (2016–2026). "HSU mason jar analysis". Appropedia. Retrieved July 28, 2026. |