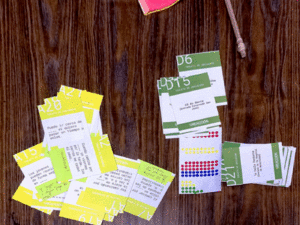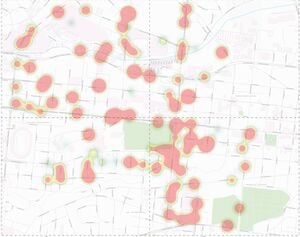
Understanding scientific concepts is a crucial factor in motivating dabblers at the start of co-created citizen science projects. This article describes PACMAC, a card-based cooperative card game aimed at introducing dabblers to hypothesis and falsifiability concepts through visualizing a social perception map. The game was evaluated in five neighborhoods in El Salvador. The results showed that PACMAP is approachable for participants of different demographics to develop an understanding of the concepts of hypotheses and falsifiability.
Required materials[edit | edit source]
- Deck of cards
- Pen and pad
- Computer to run the script
- Projector
How to play[edit | edit source]
- A group member is selected as moderator and given the decks of cards facing down. The moderator may shuffle each deck separately.
- The moderator will draw one card from each deck. They will use the text to complete the phrase (scenario and location).
- The group will raise their hand if they disagree with the statement. The facilitators will take note of three things:
- The card code for both cards drawn by the moderator (for example, S10 for "scenario 10" and L32 for "location 32").
- The number of negative votes.
- After several rounds, the facilitators will load the observations on a spreadsheet and run the script to generate a map.
- The resulting map will be shown on the screen for participants to discuss and validate the results.
