This paper aims at 1) Vegetable Recognition and 2) Size Detection
Using a binocular stereo camera, it obtains 1) Colorful Images and 2) Depth maps
It can classify Cucumber, Eggplant, Tomato, and Pepper (locates 6 points for each object). This method can classify four common vegetables within 60 cm and accurately estimate their diameter and length.
Measurement based on edge detection can briefly describe the size. They cannot calculate the length of complex-shaped fruits.
To solve the decrease in distance problem, they project the pixel distance of critical points on RGB images into 3D space.
Data preparation:
· I am labeling a standard everyday object in COCO dataset with 1600 images to train critical points.
· They obtain RGB images and depth maps of things using a RealSense depth camera.
The pre-trained key point region-based CNN classifies vegetables and locates them at multiple scales. -> the vegetable size is estimated by calculating the distances between key points. Dectron2 platform identifies the vegetable's type and finds six key points (peduncle, top, left, bottom, right, and center)
Acquiring RGB image and depth map:
Start > set image size to 640 x 480 > get RGB frame, and depth frame > align depth frame to RGB frame > fill the depth frame > output RGB image and depth image > end.
Vegetable Size Estimation
output: pixel coordinates (x,y) of critical points on the RGB image. The depth map provides the distance between the vital energy and the camera.
The left and right key points are used to estimate the diameter. The top and bottom are used to measure the length, and the center key point is used for calculating depth. Peduncle’s key point is the picking point reserved for automatic harvesting.
Ways to calculate the distance in 3D space:
· Calculate the 3D space coordinates of critical points by projecting them into the 3D space. Then, use the 3D coordinates to directly calculate the distance between the two points. (Theoretically, this method gives a more accurate distance but loses the depth at the edge of the object)
· Calculate the pixel distance d between two points in the RGB image, then map the pixel distance to the 3D space. Meanwhile, correct the distance error caused by the depth difference between different key points with mathematical methods. Results
- Vegetable Classification
When the depth is less than 80 cm, the correct rate for the four vegetables is very high, close to 100%. When the depth is greater than 80 cm, the success rate decreases gradually with the depth increase. That of cucumber and eggplant dropped faster.
- Size Estimation
It used the MAPE of diameter and length estimation for these vegetables separately.
** This method needs a fancy camera, so it is not our priority.
Vegetable Disease Detection Using K-Means Clustering and SVM [2]
Vegetables are dependent on their features, and those are color, shape, size, and texture. By extracting these features, algorithms can be utilized to distinguish the vegetables. K-means clustering algorithm can detect infected vegetables by separating them from the non-anomalous ones by receiving a 2D image as an input. This can happen in three steps:
· Enhancement: pictures are resized to 250 x 250 pixels to decrease their shading index. Contrast enhancement improves the shading edges.
· Segmentation (K-means clustering): clustering algorithm segments unnatural parts from the vegetables.
· Classification(SVM): We can classify the vegetables by extracting features.
Vegetables are recognized as dependent on their features. The features are color, shape, size, and texture. We extract these features utilizing algorithms to distinguish the vegetables.
Vegetable disease detection
Taking high-quality images> removing noises (histogram equalization > image segmentation (k-means clustering transfers the image from RGB to CIELAB system) > labeling each image from the results of k-means clustering > feature extraction > classifying with SVM > recognizing whether it is infected or not.
Preprocessing: It removes the unwanted noise from the image of vegetables. It also performs histogram equalization on the image to distribute the intensities to increase the quality of the picture. Techniques used to pre-process are filter image, cron image, and resizing the image.
Segmentation: dividing the image into many meaningful parts. It can be done by k-means clustering, otsu thresholding, watershed, etc.; We segment the image from CIERGB to CIELAB. K-means clustering is applied to L*a*b* images with 3 clusters.
Accuracy = (No. of correct output / Total no. of image tried) x 100
K-means clustering algorithm
Defining no. of clusters > choosing the centroid > clustering image points based on the distance of their intensity values from the intensity values
Principles, developments, and applications of computer vision for external quality inspection of fruits and vegetables: A review [3]
Using traditional computer vision systems (RGB) cannot detect unobvious defects. A typical spectral image is composed of monochromatic images corresponding to specific wavelengths. Hyperspectral and multispectral computer vision systems have a natural advantage compared to traditional computer vision, even human vision. The most efficient wavelengths might be very different in inspecting bruises or rottenness. The efficient wavelengths can generally be selected from the raw spectrum, preprocessing spectra, or some multivariate analysis (pattern recognition) techniques.
The location of the wavelengths where peaks or valleys occur in the raw spectrum may be the most efficient wavelengths. Determining the efficient wavelengths directly according to the raw spectrum is the simplest way to select the efficient wavelengths. However, the peaks and valleys are not always efficient in some inspection situations due to the existing noise and baseline shifts. Therefore, spectrum preprocessing is always essential before selecting efficient wavelengths according to the peaks and valleys.
Principle Component Analysis (PCA), Independent Component Analysis (ICA), Minimum Noise Fraction (MNF), Partial Least Squares (PLS), Linear Discriminant Analysis (LDA), Stepwise Discrimination Analysis (SDA), and Artificial Neural Network (ANN) are the most commonly used multivariate analysis methods in hyperspectral image analysis, dimension reduction, and efficient wavelength selection.
Fruits and Vegetable Quality Evaluation Using Computer Vision: A Review [4]
enhances image data that overcomes reluctant distortions and enlarges the features of image data. The approaches used for image pre-processing for food quality assessment are pixel pre-processing and local pre-processing.
· Pixel preprocessing: converts an input image into an output image such that each output pixel is correlated to the input pixel having the corresponding coordinates.
· Local pre-processing (Filtration): t uses a small neighborhood of a pixel in an input image to produce a new brightness value in the output image”. It uses a simple filter (reduce noise), median filter(reduce peak noise), and modified unshaped filter (to identify cracks in eggs).
Segmentation
The primary function is to separate the background for processing the significant area during the objective evaluation. Proper segmentation is crucial for further progress in image analysis; improper segmentation will diminish the classifier’s performance. The most common segmentation methods are thresholding and clustering. Hard Clustering is a straightforward technique that segments the image based on pixels belonging to identical clusters. An example of hard clustering is one k-means in which the distance from the center is evaluated then each pixel is assigned to the closest center.
Feature Extraction
· Color Features: It is an indirect measure of quality. The color feature has many advantages like high efficiency, ease in extracting color information from images, size and orientation independence, power in representing visual content of pictures, robustness to background complications, and power in separating images from each other. Many researchers have introduced various color features, including color correlogram, color coherence vector, color moments, color histogram, etc. Among them, the color moment is simple and effective. The most ordinary moments are mean, standard deviation, and skewness. As RGB is nonlinear with the visual inspection of human eyes, it cannot analyze the sensory properties of food products. CIELAB color space characterizes all the colors clearly to the human eye. It was designed to present a device-dependent model to be used as a reference where ‘L’ is the measure of lightness, ‘a, and ‘b’ changes the red/green and green/blue balance, respectively. It is perceptual uniform such that color differences a human perceives are the same as Euclidean Distance in CIELAB space. Since the color measured by computer vision can be easily analyzed with dye obtained from CIELAB color space, it offers a feasible way to evaluate the performance in measuring the object’s color.
· Morphological Features: The distance of two neighboring pixels results in feature extraction. Regardless of the shape or orientation, once the object is segmented area and perimeter are stable and efficient. To quantify the size, length and width are used. The shape of food products usually changes during processing. So, the orientation at which length and width are calculated needs to be restored in time. The longest line across the object, obtained by the distance of every two boundary pixels, is the significant axis. The two categories of shape descriptors are 1) region based (based on the integral area of the object) and 2) contour-based (boundary segmented using local features). To sort Strawberries, lemons, and citrus, diameters are used(MinMax Diameters).
Identifying Apple Surface Defects Using PCA and Artificial Neural Networks [5]
Artificial NN and PCA were used to detect surface defects in 'near-infrared' images. Neural networks were trained and tested on PCA sets. PCA components were derived from columns of pixels from images of apples at two wavelengths. In the end, this method can detect 79% of the defects in a test set with 185 defects.
Certain wavebands are suited for the detection of surface defects on 'apples'.
· 540 nm produces the best segmentation of defects caused by blister spots.
· 750 nm performs best for a bitter pit, chemical damage, corking, cracking, fly speck, hail damage, leaf roller, rot, scab, and sooty blotch.
· 950 nm is the optimal wavelength for detecting bruises, punctures, and scalds.
PCA: used for data reduction.
NN: used for classification problems.
Shadows, surface irregularities, and the rim of the apples also show up in a darker shade, making it difficult to use simple segmentation based on gray values to identify defects. -> NN based on examples of defects and non-defective surfaces, can reasonably separate these two groups.
The steps to create NN:
Images are perceived as a matrix in which columns represent samples and the individual pixel values are variables.
Columns are sorted into two classes based on whether or not they include defects or not.
The entire data matrix can be subjected to data reduction by PCA and the most significant PCs can be used to train the NN.
Principal component analysis transformed the original data into a new data space, defined by a new set of axes, generally known as eigenvectors.In this space, the first axis represents the maximum variation in the original data set, the second axis represents the next highest amount of variation, and so on. Note that in Python, the important eigenvectors start from the last axis.
In PCA, the columns of pixels were substituted by a column of PCs. The advantage: the number of PCs is considerably lower than the number of pixels, and the PCs provide an optimized basis for classification. Each column of PCs was assigned a value of “zero” if did not represent a defect or “one” if it did represent a defect. This matrix is used to train the 3-layer-network:
layer1: Sigmoid
layer2: Sigmoid
layer3: linear
It's not a feed forward one. Back propagation is used to train with a 'Fletcher-Reeves' update conjugate gradient algorithm.labeling the training set is done half manually.
The ideal situation would be to use 'raw' images, meaning images taken directly from the camera. It is somehow impossible to do so. Consequently, images need to be processed in different steps.
Removing the background: converting the image into grayscale image > determining the thresholding value > it shows the location of the fruit > determines whether each pixel value is a background or not > the column is next resized ---> this, significantly improves the performance
Image frames reduced to 60 degrees of the apple surface
Filtering the images: to limit the small surface irregularities that lead to false positives, images are filtered with 'Wiener' using a 3x3 matrix. Wiener filter is a type of linear filter that adapts itself to an image based on the local image variance. Where the variance is large, the filter performs little smoothing. Where the variance is small, more smoothing is performed. This approach ensured that dark spots as a result of blemishes and bruises were left unchanged by the filtering, although small irregularities were reduced.
Synthetic-to-real Composite Semantic Segmentation in Additive Manufacturing [6]
The CAD files on Thingiverse forms the basis for generating a database of synthetic images > The STL files from the previous step will be converted to G-Codes > The functional component of the repository was used as a basis for importing G-code files into the graphics engine. To create photorealistic renders, scenes similar to real physical environments were created in Blender. The position of the camera, as well as the degree of illumination and the location of light sources, were chosen to closely match the actual workspace.
An Instance Segmentation Model for Strawberry Diseases Based on Mask R-CNN [7]
Classical vc. Deep Learning-Based Approaches: It is impossible to eliminate impact of scene variations for conventional algorithms. However, deep-learning based approaches reach higher accuracy compared to to conventional ways but it is computationally more costly due to the training time.
Detection: It aims at predicting the class information of the objects in the picture. Object detection provides more flexibility with regards to the direction and the distance the input images are captured.
Segmentation: The predictions produced by a segmentation model are much more fine-grained in comparison to a classification or a detection network.
Dataset: The dataset consists of images that are collected in real fields instead of a laboratory. Consequently, it introduces multiple challenges such as having background variations, complex field conditions, different illumination settings, etc. So, these variations makes us design models that have a higher capacity to be more robust and generalizable. It consists 2500 images for strawberry disease that are collected with mobile phones. The diseases are verified by experts. The dataset is composed of seven different types of strawberry diseases, with images ranging from initial, middle and final stages of the diseases. The dataset is split into 1450, 307 and 743 images for training, validation and test sets, respectively.
Quality Grading of the Fruits and Vegetables Using Image Processing Techniques and Machine Learning: A Review [8]
This review tries to solve the problem of finding picking fruits automatically in supermarkets based on their color, texture.
Input image: It holds a fruit or vegetable of single variety in random locations and in any number. Objects in a plastic bag can shift the hue and their reflections may change. Consequently, the system should be able to reach a higher accuracy using fewer training data.
To form the feature vector: crop > resize > extract the mean and range of hue and saturation channel of HSV
Vegetable quality is often measured in terms of 'color', 'shape', 'mass', 'firmness', 'size' and 'absence of bruises. Tomatoes and lemons are classified based on their size and color.
The system first obtains image of a red peach region > matching expansion recognizes the entire region > the potential center point of the fitting circle is measured by the intersection of the perpendicular bisector of the line on the contour > the center point & the radius of the fruit is measured by the statistical parameters of the potential center points.
Automated visual fruit detection for harvest estimation and robotic harvesting [10]
Object categorization can be beneficial outside its conventional applications like face/ pedestrian detection.
2D image segmentation adds extra info by using thermal cameras.[11] >> consequences: computationally complex > time-consuming
Thermal imaging can be problematic in terms of accuracy -> cannot be a universal model (fruit is not directly exposed to sunlight)
Goal of this paper: 2D info can be sufficient for object detection or localization.
locate fruit in individual images > aggregating the estimate from multiple image (multiple views needed)
Dataset
positive training: containing different representations of the strawberries (e.g. different illumination conditions, different orientations, partially occluded by branches and leafs, different viewpoints, ...)
negative training: the objects are removed. The remaining image pixels are used as background information, maintaining application specific background knowledge.
camera: two AVT Manta cameras both having a 1292 964 pixel resolution.
250 training images, 750 test images, 1500 labeled train images. (35 x 38)
Goal: to provide the location of all ripe strawberries given an RGB color input image of the scene.
Approach
Build a cascade classifier model using AdaBoost (It ignores color information, focuses on gradient information by comparing regions of pixel intensities in the grayscale image)
First a model was built with both ripe and unripe so that it separates strawberries from the background.
The second model uses unripe strawberries as negatives.
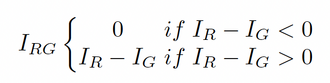
adding a color descriptor to the learning process ~> to avoid the loss pf valuable color information and make it possible to separate between ripe dark red and unripe green strawberries.
The equation supports red colored regions while it ignores the greener regions.
color transformation can help detect ripe strawberry (if more than 50% of the detected pixels yield ~> ripe) > post-processing is more time-consuming and less accurate compared to the pre-processing filter.
Splitting object clusters into separate object instances
Identifying single objects within clusters:
Watershed-based segmentation: returns regions of interest containing individual strawberry detections > white pixels merge together > cope with the negative effect of color transformation > the centers of all detections are used as initialization positions for a watershed based segmentation >The borders of each region are defined by the merged binary image, pinpointing areas with possible strawberry pixels> defining the borders of each region by the merged binary image, pinpointing areas with possible strawberry pixels.
Tinoclular stereo triangulation based segmentation: avoids the harsh boundaries of the watershed segmentation > the location of each strawberry is known in the given 2D images > Difference if Gaussian filter
[1] B. Zheng, G. Sun, Z. Meng, and R. Nan, “Vegetable Size Measurement Based on Stereo Camera and Keypoints Detection,” Sensors, vol. 22, no. 4, Art. no. 4, Jan. 2022, DOI: 10.3390/s22041617.
[2] U. Rahamathunnisa, M. K. Nallakaruppan, A. Smith, and S. Kumar K.S., “Vegetable Disease Detection Using K-Means Clustering And Svm,” in 2020 6th International Conference on Advanced Computing and Communication Systems (ICACCS), Mar. 2020, pp. 1308–1311. DOI: 10.1109/ICACCS48705.2020.9074434.
[3] B. Zhang et al., “Principles, developments, and applications of computer vision for external quality inspection of fruits and vegetables: A review,” Food Research International, vol. 62, pp. 326–343, Aug. 2014, DOI: 10.1016/j.foodres.2014.03.012.
[4] A. Bhargava and A. Bansal, “Fruits and vegetables quality evaluation using computer vision: A review,” Journal of King Saud University - Computer and Information Sciences, vol. 33, no. 3, pp. 243–257, Mar. 2021, DOI: 10.1016/j.jksuci.2018.06.002.
[5] B. S. Bennedsen, D. L. Peterson, A. Tabbn "Identifying apple surface defects using principal component analysis and artificial neural networks", American Society of Agricultural and Biological Engineers, vol.50, no. 6, pp.2257-2265, 2007, ISSN 0001-2351 Link
[6] A. Petsiuk, H. Singh, H. Dadhwal, and J. M. Pearce, “Synthetic-to-real Composite Semantic Segmentation in Additive Manufacturing.” arXiv, Oct. 13, 2022. DOI: 10.48550/arXiv.2210.07466.
[7] U. Afzaal, B. Bhattarai, Y. R. Pandeya, and J. Lee, “An Instance Segmentation Model for Strawberry Diseases Based on Mask R-CNN,” Sensors, vol. 21, no. 19, Art. no. 19, Jan. 2021, DOI: 10.3390/s21196565.
[8] M. K. Prem Kumar and A. Parkavi, “Quality Grading of the Fruits and Vegetables Using Image Processing Techniques and Machine Learning: A Review,” in Advances in Communication Systems and Networks, Singapore, 2020, pp. 477–486. DOI: 10.1007/978-981-15-3992-3_40.8]
[9] S. R. Dubey and A. S. Jalal, “Application of Image Processing in Fruit and Vegetable Analysis: A Review,” Journal of Intelligent Systems, vol. 24, no. 4, pp. 405–424, Dec. 2015, DOI: 10.1515/jisys-2014-0079.
[10] S. Puttemans, Y. Vanbrabant, L. Tits, and T. Goedemé, “Automated visual fruit detection for harvest estimation and robotic harvesting,” in 2016 Sixth International Conference on Image Processing Theory, Tools and Applications (IPTA), Dec. 2016, pp. 1–6. DOI: 10.1109/IPTA.2016.7820996.0] DOI:10.1109/IPTA.2016.7820996
[11] D. Stajnko and Z. Cˇmelik. Modelling of apple fruit growth by application of image analysis. Agriculturae Conspectus Scientificus, 70(2):59–64, 2005.
To be completed:
[] E. Saldaña, R. Siche, M. Luján, and R. Quevedo, “Review: computer vision applied to the inspection and quality control of fruits and vegetables,” Braz. J. Food Technol., vol. 16, pp. 254–272, Dec. 2013, DOI: 10.1590/S1981-67232013005000031.
[] M. Khojastehnezhad, M. Omid, A. Tabatabaeefar, "Development of a lemon sorting system based on color and size" African Journal of Plant Science Vol. 4(4), pp. 122 -127, April 2010, link
[] Y. Song, C. Glasbey, et al. Automatic fruit recognition and counting from multiple images. Biosystems Engineering, 118:203–215, 2014.
[]S. Puttemans and T. Goedem´e. Visual detection and species classification of orchid flowers. In MVA, pages 505–509. IEEE, 2015.