
NREMT Paramedic Skillset/12 Lead EKG Interpretation
This page will cover basic 12 lead interpretation acceptable for most field paramedics. Remember that this is an incredibly in depth topic, and can easily be overwhelming. With that in mind, this page will not cover more complex electrocardiographically significant findings such as, but not limited to: atrial enlargement, fascicular blocks, q-wave infarction/NSTEMI, Brugada's syndrome, Sgarbossa's Criterion, etc. All information on this page is introductory in nature and can be expanded upon; it is recommended that you perform self-study constantly even after receiving your paramedic license. This page will not cover rhythm analysis as that has been covered in the EKG Rhythm Interpretation page of this course. If you have questions regarding placement of the EKG electrodes or on the basic reasoning surrounding the production of the waveform, look to the linked portion of the Setup for ALS page from the EMT section of Appropedia. If you need a refresh on the basics of cardiac anatomy and physiology, navigate to the Physiology of the Heart page.
What is a 12-lead EKG?
[edit | edit source]A 12 lead EKG is simply 12 different views of the heart's electrical conduction system created by the placement of 10 electrodes on the patient's extremities and chest wall. The fact that there are only 10 leads for 12 views of the heart is confusing for many, but the explanation is simple: there is no dedicated, non-augmented, lead looking from the right of the heart, and there are 3 leads created by utilizing Wilson's Central Terminal (WCT) in conjunction with the (1) right arm, (2) left arm, and (3) both foot leads. (10 electrodes - 1 right sided lead + 3 computed leads= 12 leads).
A 12 lead EKG looks primarily at the left ventricle as it is both the most muscular and vascular area of the heart. In addition to the left ventricle, a baseline 12 lead will look at the left atrium and inferior wall of the heart with some clarity as well as peripherally at the right side of the heart. Note that the posterior portion of the heart is not represented at all in a normal 12 lead.
Right Sided and Posterior 12 leads
[edit | edit source]As neither the right ventricle nor the posterior of the heart is well represented in a baseline 12 lead, alternate lead placement may be necessary to adequately visualize these areas of the heart. The in both a right sided and posterior 12 lead, the limb leads are placed normally.
Right Sided 12 Leads
A right sided 12 lead should be obtained if the patient may have right sided infarction as well as any time a patient presents with inferior wall infarction. As we will discuss later, the RCA typically feeds the inferior wall of the heart, and because the right side is not well represented on a baseline 12 lead, a right sided 12 lead can help localize the blockage or lesion and see if there is any right ventricular involvement (RVI). For most purposes, moving V4 across the sternum to the same position on the right as it was on the left (mid-clavicular, 5th intercostal) is sufficient to determine RVI. Otherwise, lead placement for a right sided 12 lead follows the same paradigm as normal 12 lead placement, just with each lead placed on the opposite side of the body than it would have been normally.
Posterior 12 Leads
Posterior 12 leads are rare in the prehospital environment and should only be performed if no more urgent actions need to be taken or unless you suspect a localized posterior infarction with no extension (this is fairly rare). This is because a posterior MI is treated identically to an anterior or left sided MI in almost all prehospital environments due to the lack of specialized equipment needed (e.g. a catheterization lab at a hospital). If you are interested in learning to place leads for a posterior 12 lead (sometimes known as a 15 lead if there are sufficient leads available), go to this page on the Life in the Fast Lane blog.
The EKG on Paper
[edit | edit source]Before learning to interpret a 12 lead, it is important to be familiar with the format of the printout. This section will introduce you to the EKG printout as well as localization of infarction to both arteries and tissue location within the heart.
The EKG Printout
[edit | edit source]
- Paper Speed: The paper speed for an EKG is normally set to 25 mm/sec. This may be changed on some machines and can lead to incorrect rate, rhythm, and interval analysis if the change is missed. Most prehospital monitors do not allow for paper speed to be changed. Paper speed can be found in the lower left corner of Figure 1.
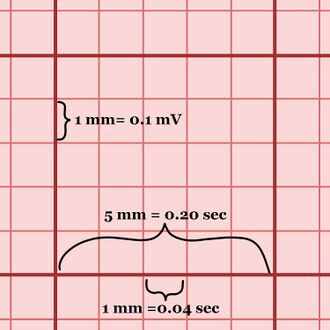
Figure 2. A large box on EKG paper that has been magnified with some of the measurements shown. - Magnification: Magnification on the 12 lead is found by the rectangle at either the beginning or end of the printout and occasionally in numerical form on the printout. Be familiar with whether your monitor allows for changes in magnification on the printout; many prehospital monitors allow for magnification on the monitor screen but not on the EKG printout. Magnification can be found before leads I, II, and III in Figure 1 (this is standard magnification: 5 mm wide, 10 mm tall).
- Frequency: Frequency allows the EKG to correctly show the data. For an EKG to have diagnostic capabilities, it should have a minimum frequency of 0.5 Hz. Most commercial machines allow for a frequency of 0.5 Hz to100 Hz or 150 Hz. Frequency can be found in the lower left corner of Figure 1.
- "Small" and "Large" Boxes: As you look at the EKG paper, you will find many large boxes with a grid of smaller boxes within them. As seen in Figure, 2, one large box is 5 small boxes long and 5 small boxes tall. Each small box is 1 mm x 1 mm; at normal magnification and paper speed, one small box is ALSO 0.1 millivolt tall and 0.04 seconds long. There are 5 large boxes per second and and 300 large boxes per minute. An easy way to find an estimation of your patient's heart rate is to take the number of large boxes between two concurrent R-waves (or any other similar point) and divide 300 by that number. As an example, a patient with 5 large boxes between each R-wave would have an estimated heart rate of 300/5 = 60 bpm.

Lead Layout
[edit | edit source]
This section discusses the most common layout of 12 leads at the time of writing. As always, know that different systems may utilize different machines and make an effort to be up to date with your system's devices. The majority of 12 leads are printed as 4 columns of 3 leads each. Each column is 2.5 seconds long (roughly 62.5 small boxes) meaning that the aggregated 12 lead is 10 seconds long. Many hospital based EKG machines will also produce a rhythm strip at the bottom of the printout (shown boxed in blue in Figure 3) that will be mentioned later. Due to space constraints on the page, most portable EMS monitors do not provide this rhythm strip. A 12 lead is laid out with leads I, II, and III in the leftmost column; aVr, aVL, and aVF in the second colum; V1-3 in the third column, and V4-6 in the fourth column. The reason that these columns are important to note is that the tracing is contiguous as time goes by, meaning that each column is a snapshot of 2.5 seconds of the patient's rhythm. Complexes within each column are the same (from different angles), but the second complex from column 1 and the second complex from column 2 are completely different. Despite each column being different temporally, it is entirely possible to utilize an easier to see lead like II to help differentiate between waveforms of leads within the same column (e.g. if lead III has easily visible QRS complexes but very small P-waves and lead II shows the opposite, it is possible to use the P-waves from lead II and the QRS complexes from lead III to determine the PR interval).
Limb vs. Precordial leads
[edit | edit source]There are 10 electrodes, 4 of which are placed on the extremities of the patient (LA, RA, LL, RL) while the other six are placed on the patient's chest (V1-V6). The four extremity leads are known as limb leads while the chest leads are known as precordial leads. Although there are only 4 physical limb electrodes, they produce 6 leads (I, II, III, aVR, aVL, aVF). Leads I, II, and III are created by a combination of two physical electrodes and are such called bipolar limb leads. In contrast, aVR, aVL, and aVF are created using a combination of a physical electrode and Wilson's Central Terminal (WCT) described earlier. As WCT is not a physical lead, the augmented voltage leads are known as the unipolar limb leads. The precordial leads are created by a combination of an electrode and WCT like the unipolar limb leads. Because so many of the leads rely on WCT for correct display and analysis of electrical activity, it is imperative that all leads be placed correctly for accurate and precise representation of the cardiac conduction system.
Leads and Anatomy Localization
[edit | edit source]
This section will cover the anatomy and localization of the leads of a 12 lead. This includes both the physical area of the heart that the leads are "looking at" and the main arteries that feed that area. In the arena of cardiology, localization is the act of determining the area of damage or infarction and the artery or arteries that feed that area. Localization allows providers to more effectively treat their patients and can help them avoid potential harm to the patient. There are 6 areas of interest for a paramedic to learn when interpreting a 12 lead. If there is a finding present in several areas, they may be combined (e.g. a STEMI pattern in both inferior and lateral areas would be called an inferolateral STEMI). Figures 5-9 may help you visualize the following content. If you have issues visualizing the reason certain leads "look" at certain areas, Figure 4 shows how the limb leads "look at" the heart using the limbs. Localization information has been reduced to a level appropriate for paramedics.
High Lateral
Leads I and aVL look at the high lateral left ventricle and atria. This area is generally fed by the left circumflex artery.
Inferior
Leads II, III, and aVF look at the inferior wall of the heart. This area is generally fed by the right coronary artery but is rarely fed by the left circumflex artery.
Septal
Leads V1 and V2 look at the septal wall of the heart. This area is generally fed by the left anterior descending artery.
Anterior
Leads V3 and V4 look at the anterior wall of the left ventricle. This area is generally fed by the left anterior descending artery.
Lateral
Leads V5 and V6 look at the lateral wall of the left ventricle. This area is generally fed by the left circumflex artery.
Posterior
This area of the heart is not visible on a baseline 12 lead. A posterior 12 lead is necessary, and V7, V8, and V9 look at the posterior of the heart. The posterior is generally fed by the posterior descending artery (coming from either the RCA or LCx).
-
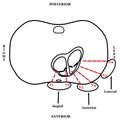 Figure 5. The precordial leads and their localizations.
 -
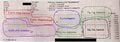 Figure 6. I & aVL: High Lateral; II, III, & aVF: Inferior; V1 & V2: Septal; V3 & V4: Anterior; V5 & V6: Lateral.
 -
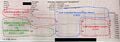 Figure 7. I, aVL, V5, & V6: Left circumflex; (LCx) II, III, and aVF: Generally right coronary (RCA); V1-V4: Left anterior descending (LAD)
 -
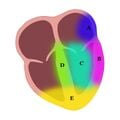 Figure 8. A) High Lateral B) Lateral C) Anterior D) Septal E) Inferior. Not shown: Posterior.
 -
 Figure 9. Coronary arteries


Analysis
[edit | edit source]Rate Determination
[edit | edit source]Analysis of your patient's rate is an important part of any rhythm or 12 lead interpretation and in some cases, it is the determining factor for treatment. This section will give four common methods of rate determination in order of accuracy.
The "times by 10" method
The "times by 10 method is primarily used if the provider does not have a 12 lead but instead has a long rhythm strip. This method is the least accurate for regular rates but is more accurate than others for irregular rates. This method is less useful than the "times by 6" method when using a 12 lead as most 12 leads are printed in 10 second strips. In the scenario where you have a long rhythm strip, you can count out 30 large boxes and then count how many QRS complexes fall within those 30 large boxes. Multiply by 10 and you have an estimation of your patient's heart rate.
The "times by 6" method
This method uses the 10 second strip printed during a 12 lead to approximate the patient's heart rate. For the approximation, count the number of beats occurring during the 12 lead and multiply by 6 to gain the beats per minute.
The "300-150-100" method
As previously mentioned in the EKG Printout section, one of the faster methods of determining a patient's heart rate is to divide 300 by the number of large boxes between similar points on concurrent waveforms. This method can be further simplified by just remembering the result of the division and counting from one R-wave to another. The sequences is as follows: 300, 150, 100, 75, 60, 50, 45, 37, 33, 30. This method is anecdotally the most commonly used method in the prehospital setting.
The "divide into 1500" method
This method takes the "300-150-100" method and breaks the large boxes down into small boxes. Instead of counting the number of large boxes between R-waves and dividing from 300, this method has the provider count the number of small boxes between R-waves and then dividing from 1500. Although this method is the most accurate determination of heart rate, its calculations also take significantly longer than any of the previously discussed methods, so it is rarely used in the prehospital setting.
Intervals and Timing
[edit | edit source]A recap of the basic waveforms and interval analysis can be found in the EKG Rhythm Interpretation section of this course.
PR Interval: The PR interval is normally between 0.12 and 0.20 seconds (120 and 200 milliseconds). This equates to 3-5 small square boxes.
QRS Duration: The QRS duration is normally less than 0.12 seconds (120 milliseconds). This equates to less than 3 small square boxes.
QT Interval: The QT interval is normally between 0.36 and 0.44 seconds (360 and 440 milliseconds) for a heart rate of 60 to 100 bpm. This equates to 9-11 small square boxes. The QT interval is also prolonged if it is greater than 1/2 the RR interval.
ST Segment
[edit | edit source]
The J-point
The J-point is the point where the QRS complex meets the ST segment. It can generally be easily found by looking for the point at which the S wave meets the isoelectric line with a sharp angle. In some cases, an angle such as this does not exist due to a slurred S-wave or similar phenomenon. In this case, there is no specific consensus on how to determine where the J-point exists.
ST Depression
ST depression indicates ischemia (or may indicate infarction as a reciprocal change) and is seen when the ST segment is depressed greater than 1 mm below the isoelectric line. ST depression can be clinically significant if found in 2 or more leads "looking at" the same area, or in 2 or more numerically contiguous precordial leads (e.g. V2 & V3, V4 & V5).
ST Elevation
ST elevation indicates infarction and is seen when the ST segment is elevated greater than 1 mm above the isoelectric line, as seen in Figure 10 where there is 2 mm of ST elevation. ST elevation can be clinically significant if found in 2 or more leads "looking at" the same area, or in 2 or more numerically contiguous precordial leads (e.g. V2 & V3, V4 & V5). Some sources allow for ST segment elevation of up to 2 mm in leads V2 and V3, but most EMS protocols do not follow this paradigm.
Reciprocal Changes
Reciprocal changes are variations in waveform that are caused by infarction of tissue directly "across" the heart from the area of tissue the lead with the change is "looking at". For example, anterior (V3 and V4) ST depression may potentially be a reciprocal change of posterior infarction (which would show as elevation in V7, V8, and V9). Reciprocal changes can be found in several places and should prompt the provider to investigate if they are found.
Bundle Branch Blocks
[edit | edit source]
There are two main types of bundle branch blocks: left and right. The bundle branches arise from the Bundle of His and are integral parts of the cardiac conduction system. When a bundle branch is "blocked" by a lesion or infarction, some characteristic EKG changes may be found. Although bundle branch blocks may be chronic and benign, they are unable to be treated prehospitally, so this section will not focus on the creation of the waveform, incomplete bundle branch blocks, or most possible etiologies. It is important to know, however, that a new onset bundle branch block may be treated as an analog to myocardial infarction in patients displaying signs of ACS for most prehospital providers. Bundle branch blocks will increase the QRS duration to greater than 120 ms and can be confusing for providers when combined with rhythms such as SVT (which may look like ventricular tachycardia to providers). Bundle branch blocks can also be STEMI mimics, which will be briefly discussed later.
Right vs. Left Bundle Branch Block
[edit | edit source]The fast and easy way to fairly reliably determine which bundle branch is blocked if you suspect a bundle branch block is the "turn signal" method. In this method, a right bundle branch block is identified if the QRS complex in V1 is primarily upright (in the direction you would move the turn signal to turn right). A left bundle branch block is simply the opposite, i.e. the QRS complex in V1 is primarily down (in the direction you would move the turn signal to turn left). Keep in mind that this is in no way the clinically proven way to identify a right or left bundle branch block and does not account for many potential concurrent conditions that could widen the QRS complex. Despite that, this method is sufficient for paramedic students at this point in time.
Electrical Axis
[edit | edit source]
Electrical axis is the direction of the net electrical vector in the heart and is measured in three dimensions. The electrical axis can be found by manually computing the angle of the electrical vector using the x, y, and z axes but this computation is far and above what a paramedic is expected to be able to perform in a short amount of time in the field. For our purposes, a normal electrical vector will only have two components (x and y) and will be found in the same plane as the limb leads (frontal plane) as seen in Figure 12. Figure 11 shows both the angle at which each of the limb leads "looks at" the heart as well as the four (or five if a physiological left axis is considered separate) axes. Calculated electrical axes for P waves, QRS complexes, and T waves can be seen on the 12 lead in Figure 1, although the QRS axis is the only one this page will cover. Any abnormal axis deviation should be thoroughly investigated as it may be an indication of a previously unnoticed problem.
How to quickly determine XY axis and deviation
[edit | edit source]Although paramedics may not be required to calculate the precise angle of the XY electrical axis, they are certainly responsible for being able to recognize the basic axis as normal, left, right, or extreme. This section will give an explanation of two ways to quickly calculate the electrical axis.
- Using the hexaxial reference system (Figure 12): Look at Lead I, if it is primarily positive, the axis is on the right side of the circle (left or normal axis). Look at lead aVF, if the lead is primarily positive, the axis is on the bottom half of the circle (normal or right axis). The area of overlap between the two leads (I and aVL) will give the true electrical axis (ex. negative Lead I = right or extreme axis, positive Lead aVF = right or normal axis, combined = right axis deviation).
- Using the "Thumbs up" method: This method uses Lead I and either Lead II or Lead aVF. Imagine that each lead is a fist with it's thumb (the QRS complex) extended. A positive QRS complex is a thumbs up, and a negative QRS complex is a thumbs down. There are four combinations which correspond to the four axes and are as follows:
- Two thumbs up (I +, II/aVF +): Normal Axis
- Thumbs "leaving" each other (I +, II/aVF -): Left Axis Deviation (LEFT is thumbs leaving each other)
- Thumbs point at each other (I -, II, aVF +): Right Axis Deviation (The thumbs are pointing RIGHT at each other)
- Two thumbs down (I -, II/aVF -): Extreme/Northwest Axis Deviation (Two thumbs down is the worst)
Normal Axis
A normal electrical axis is found in the lower right quadrant (bright green) of the circle (between 0 and +90 degrees) and indicates an electrical vector that travels primarily downwards and to the left, which is what would be expected considering the SA node is the primary pacemaker and is at the top of the heart and the left ventricle is much more muscular than the right (and has similarly more electrical "weight").
Left Axis and Physiological Left Axis
The left axis is found in the upper right quadrant (yellow) of the circle (between 0 and -90 degrees) and indicates an electrical vector that travels primarily left and possibly upwards. A physiological left axis (dark green quadrant) falls between 0 and -30 degrees and can be a result of normal physiological processes such as pregnancy (where the heart's physical location rotates slightly to make room for the expanding uterus).
Right Axis
The right axis is found in the lower left quadrant (light blue) of the circle (between +90 and +/-180 degrees) and indicates an electrical vector that travels primarily rightwards and downwards. Common causes for a right axis deviation include but are not limited to acute and chronic lung disease (ex. PE, COPD), right ventricular hypertrophy, WPW syndrome, and hyperkalemia.
Far/Extreme Right Axis or Northwest Axis
The extreme right axis or northwest axis is found in the upper left quadrant (dark blue) of the circle (between -90 and +/-180 degrees) and indicates an electrical vector that travels primarily upwards and rightwards. This indicates a complete reversal of normal electrical conduction and is normally associated with severe conditions such as ventricular heart rhythms (VT, IVR, etc.).
R-wave progression
[edit | edit source]R-wave progression is not a topic that will be focused on in this page as it is a more advanced topic. The only knowledge this page will contain is that the r-wave should be primarily negative in lead V1 and should transition to primarily positive in V6. The transition point (a biphasic wave) should be somewhere around V3-V4. If you wish to learn more about poor r-wave progression, check out this page on the Life in the Fast Lane blog.
Other Findings
[edit | edit source]This section will focus on frequently taught other findings on 12 lead EKGS. It is not comprehensive but is intended to add extra knowledge of testable subjects for paramedic students.
S1Q3T3
[edit | edit source]An S1Q3T3 pattern describes the phenomenon where there is a large S wave in lead I, a Q wave in lead III, and an inverted T wave in lead III.[1] The S1Q3T3 phenomenon is oftentimes incorrectly associated with diagnosis of pulmonary embolus. While the pattern is seen in around 54% of PEs, it is not pathognomonic! An S1Q3T3 pattern actually shows right ventricular strain or dilation (which is commonly found in large PE and saddle emboli).
Left Ventricular Hypertrophy (The Rule of 35)
[edit | edit source]Left ventricular hypertrophy, or LVH for short, is an increase in the musculature of the left ventricular wall caused by a variety of processes including stenotic valves, chronic untreated hypertension, and heart disease. LVH is important to know as it is the most common STEMI mimic, and LVH with a strain pattern will effectively trip up both computerized and human providers. Recognition of LVH in the prehospital setting can be achieved through the use of the "rule of 35". To use the rule of 35, first your patient must be over 35 years old. Second, you must take the deepest S wave from V1 or V2 and add the depth in mm to the tallest R wave in V5 or V6's height in mm. If the result is over 35 mm, the patient can be cautiously said to have LVH. Another criteria for LVH is an R wave greater than 11 mm in aVL.
STEMI Mimics
[edit | edit source]ST segment elevation does not always mean the patient is having a myocardial infarction, as is the case for myocarditis and pericarditis (which may both cause diffuse ST elevation). When a disease causes the patient's EKG to show ST elevation without infarction, the disease is said to be a STEMI mimic. There are specific criteria for determination of STEMI with a mimic in place, but these are much more advanced than this page will cover and can be found with outside research. Common STEMI mimics are: LVH (25%), LBBB (15%), benign early repolarization (12%), and RBBB (5%) to name a few.
Documentation
[edit | edit source]- Documentation should include a rate, rhythm and EKG interpretation with any further abnormalities or insights. For example, an interpretation of the 12 lead EKG shown in Figure 3 would be as follows: "The patient's rhythm was interpreted to be a 3rd degree heart block with junctional escape rhythm at approximately 38 bpm and slow atrial rate of approximately 42-45 bpm. A 12 lead EKG showed 1-2 mm inferior ST elevation with mild reciprocal depression in the high lateral and anterior leads." Keep in mind that this patient's rhythm shows an abnormally slow atrial rate that is likely being caused by his inferior wall myocardial infarction (IWMI) and that most 3rd degree heart blocks will have atrial rates above 60 bpm. Right sided and posterior 12 leads are likely indicated in this patient.
Self Assessment
[edit | edit source]Tips and Tricks
[edit | edit source]- When utilizing the "300-150-100" method for determining your patient's heart rate, if the second R-wave falls between two large box boundaries you can either estimate based upon which is closer or use math to get a more accurate answer. To do this, let us assume that the R wave falls on the second small box after the 4th large box boundary. Based upon the method, the rate would be between 300/4 = 75 bpm and 300/5 = 60 bpm. There are five small boxes between 75 and 60 bpm, meaning that each small box is equivalent to 3 bpm. The adjusted rate would be 300/4 = 75 bpm - (2 boxes * 3 bpm/box)= 75 - 6 = 69 bpm.
Additional resources
[edit | edit source]References
[edit | edit source]- ↑ Ullman E, Brady WJ, Perron AD, Chan T, Mattu A. Electrocardiographic manifestations of pulmonary embolism. Am J Emerg Med. 2001 Oct;19(6):514-9
| Authors | JHantke |
|---|---|
| License | CC-BY-SA-4.0 |
| Cite as | JHantke (2022–2026). "NREMT Paramedic Skillset/12 Lead EKG Interpretation". Appropedia. Retrieved July 15, 2026. |