This special page shows all uploaded files.
| Date | Name | Thumbnail | Size | Description | Versions |
|---|---|---|---|---|---|
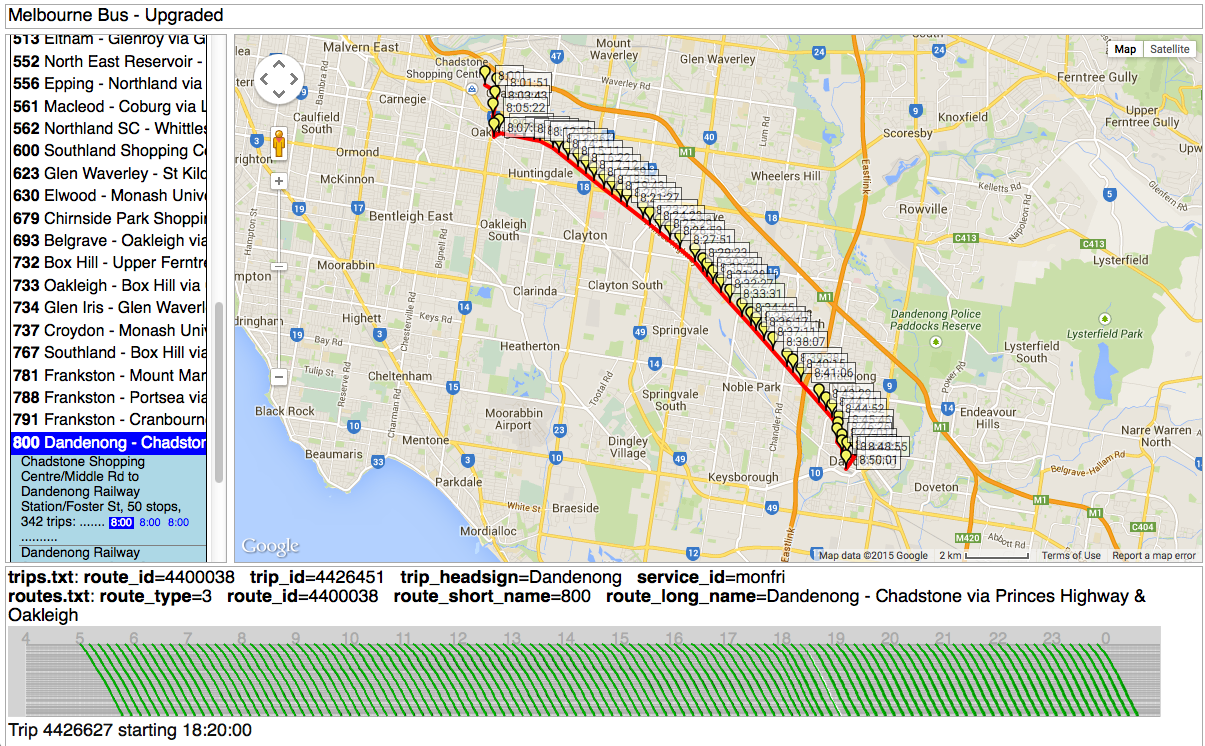
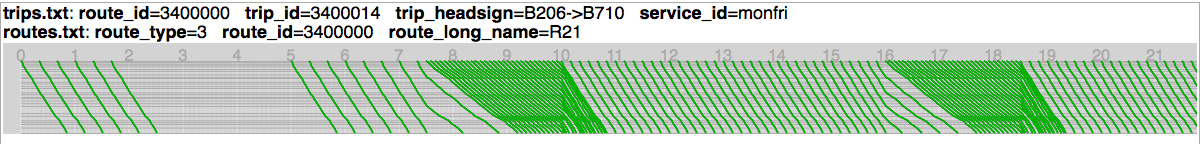
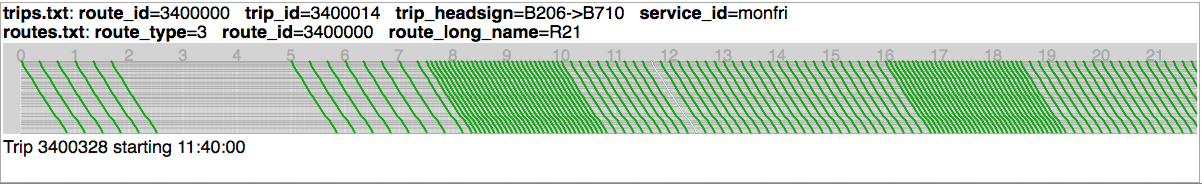
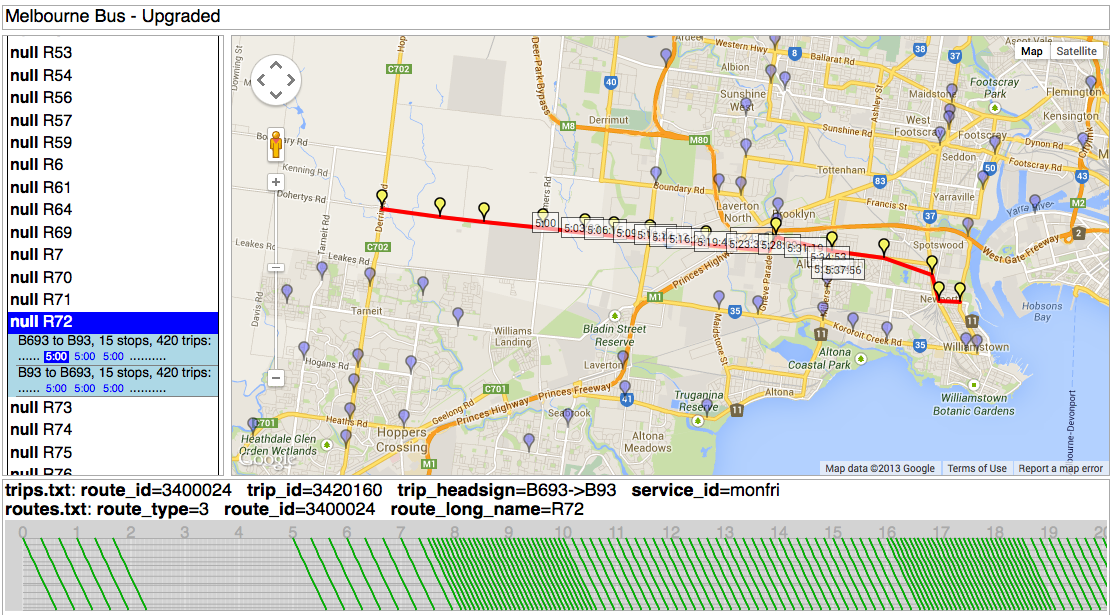
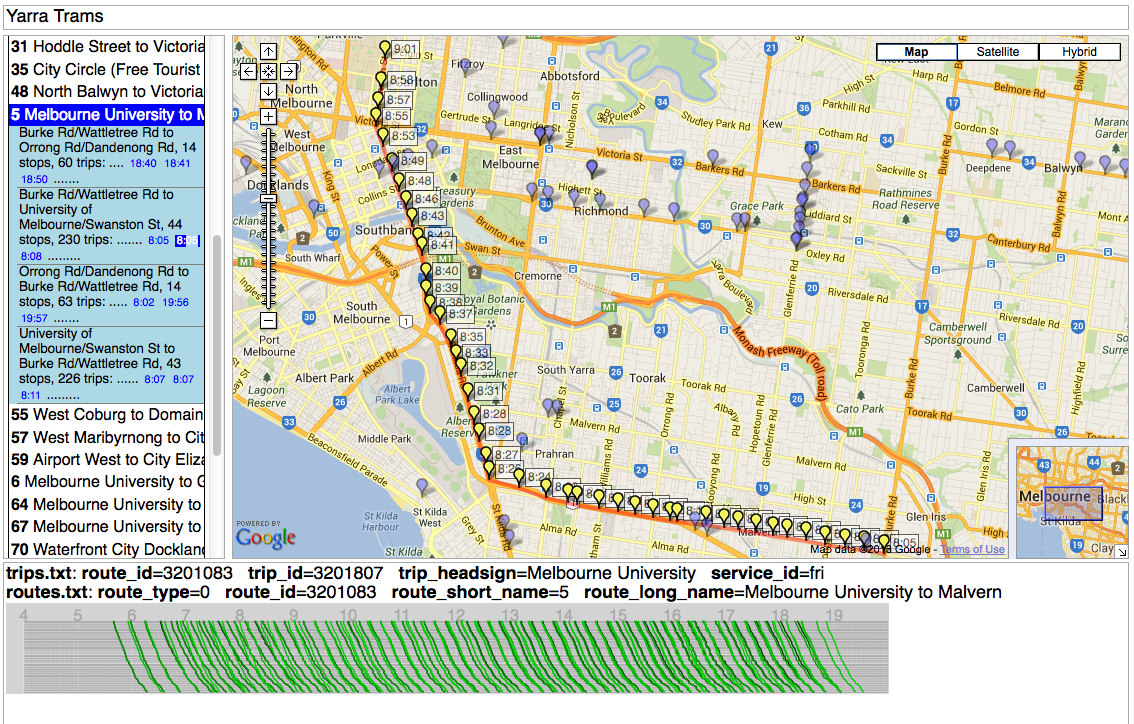
| 05:57, 11 March 2015 | OSSTIP-WPPTUA1-bus-upgrades-scheduleviewer screenshot.png (file) |  |
784 KB | A screenshot from ScheduleViewer showing timetable of one upgraded route. (I User:PatSunter took this screenshot, it is based on my own work :- I thus retain copyright of the image, but make it available here on Appropedia under a CC-BY-SA license). | 1 |
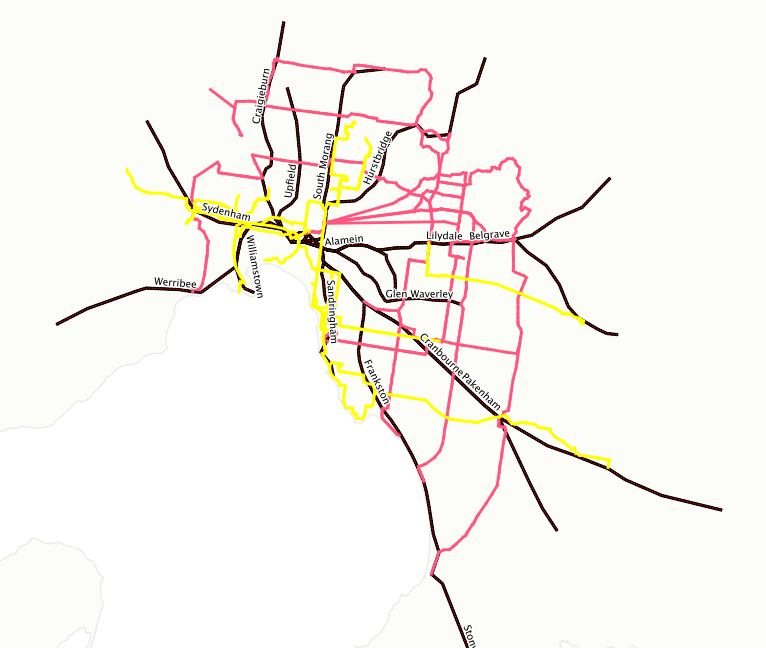
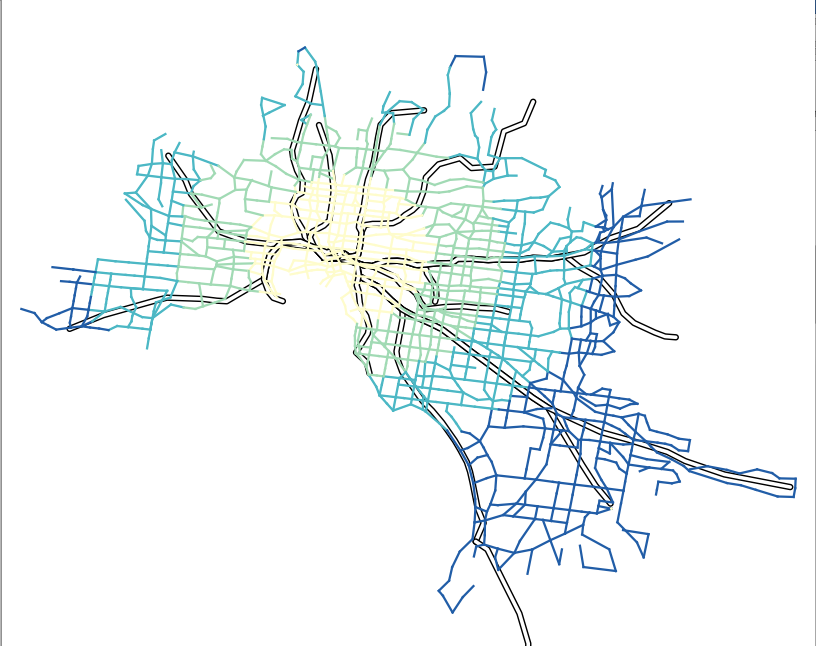
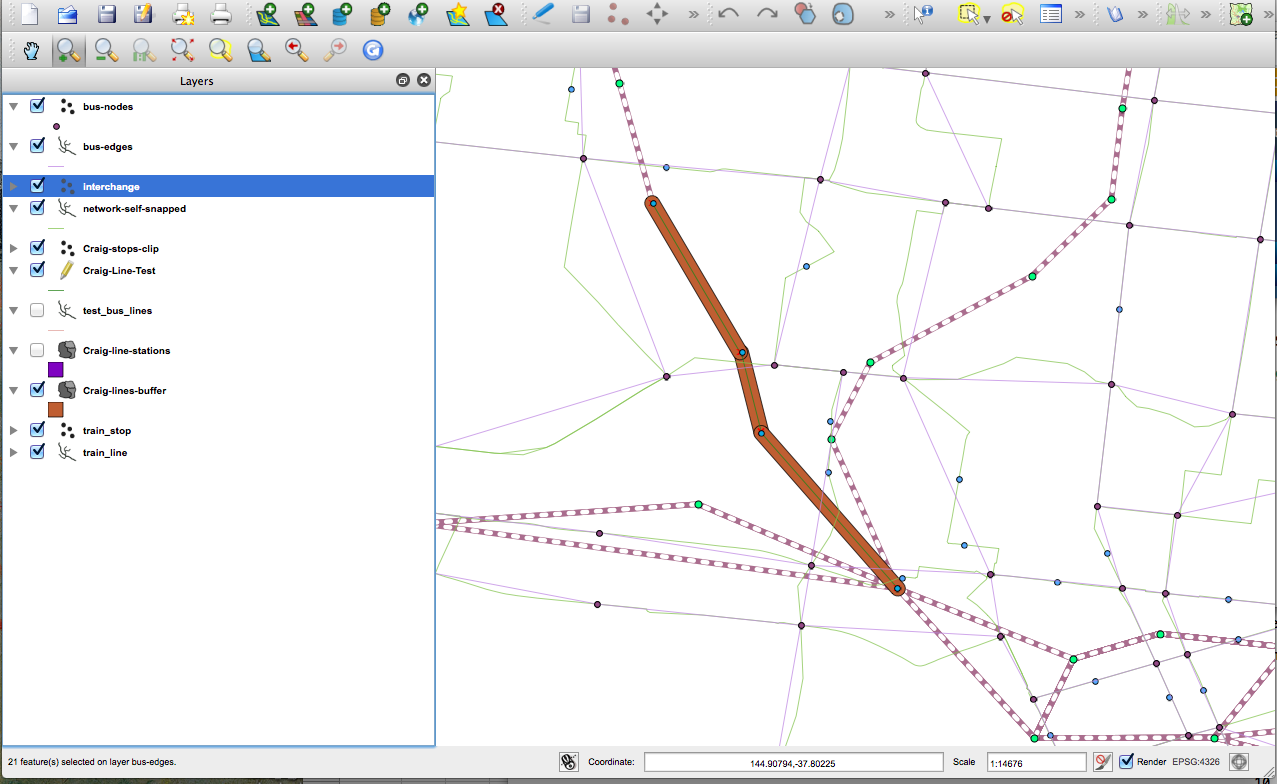
| 02:06, 11 March 2015 | OSSTIP-WPPTUA1-bus-upgrades-map-v2.png (file) |  |
157 KB | A screenshot from QGIS showing bus network route upgrades. (I took this screenshot). | 1 |
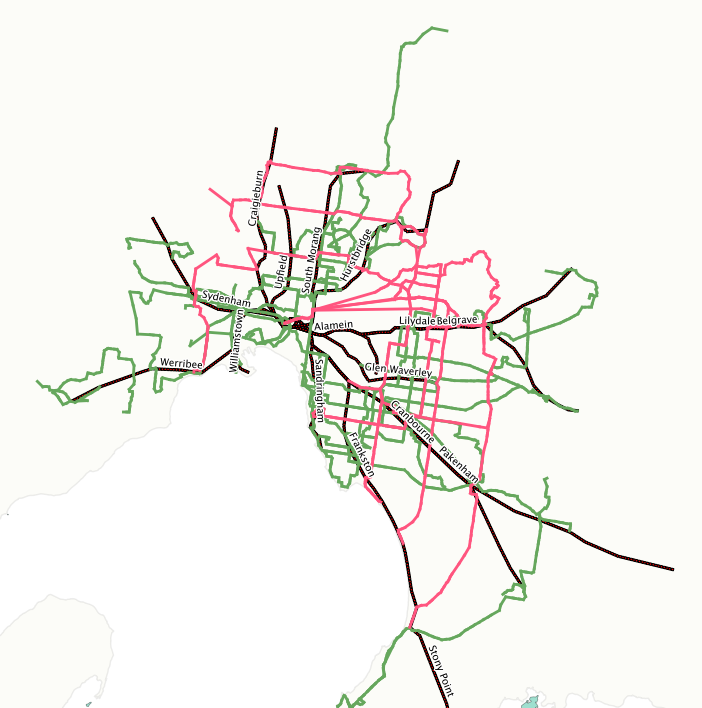
| 01:47, 11 March 2015 | OSSTIP-WPPTUA1-bus-upgrades-map-v1.png (file) |  |
130 KB | A screenshot from QGIS showing bus network route upgrades. (I took this screenshot). | 1 |
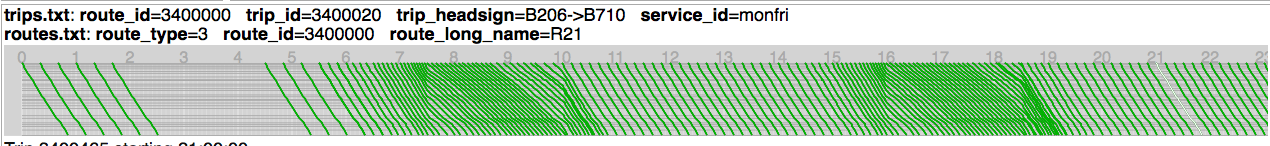
| 08:27, 11 April 2014 | Sample-route-frequencygraph-timedep-ramped-graph.png (file) | 75 KB | A time-distance graph of another bus timetable, with peak speed reductions applied, but with 'ramping' of the frequency specification applied to mitigate bunching and spreading observed by passengers throughout the network. | 1 | |
| 08:23, 11 April 2014 | 30k-peak-15k-offpeak-graph.png (file) | 51 KB | A Time-Distance graph of a bus timetable using a 30km/h 'free' speed and a 15km/hr 'peak' speed representing road network congestion. The service frequency specification is the same as for File:Constant-30k-speed-graph.png, but the speed different ... | 1 | |
| 08:21, 11 April 2014 | Constant-30k-speed-graph.png (file) | 50 KB | A Time-Distance graph of a bus timetable using constant 30km/h speed throughout the day, with service frequency varying in peak and off-peak conditions. | 1 | |
| 08:14, 11 April 2014 | Bus-speeds-peak-qgis.png (file) |  |
202 KB | Image showing reduction in bus speed in peak-hour at CBD, as per BZE volunteer's calculations based on road speed data. | 1 |
| 02:53, 23 March 2014 | MooneeValley-Accessibility-New.png (file) |  |
1.54 MB | Re OSSTIP/WPBZE1 - a screenshot produced by User:PatSunter of travelsheds of accessibility to the Moonee Valley area in Melbourne's inner Nth-East - on the PTV network of trains and trams, as of July 2013 but with BZE's expanded and redesigned... | 1 |
| 02:51, 23 March 2014 | MooneeValley-Access-Curr.png (file) |  |
1.37 MB | Re OSSTIP/WPBZE1 - a screenshot produced by User:PatSunter of travelsheds of accessibility to the Moonee Valley area in Melbourne's inner Nth-East - on the current PTV network as of July 2013. | 1 |
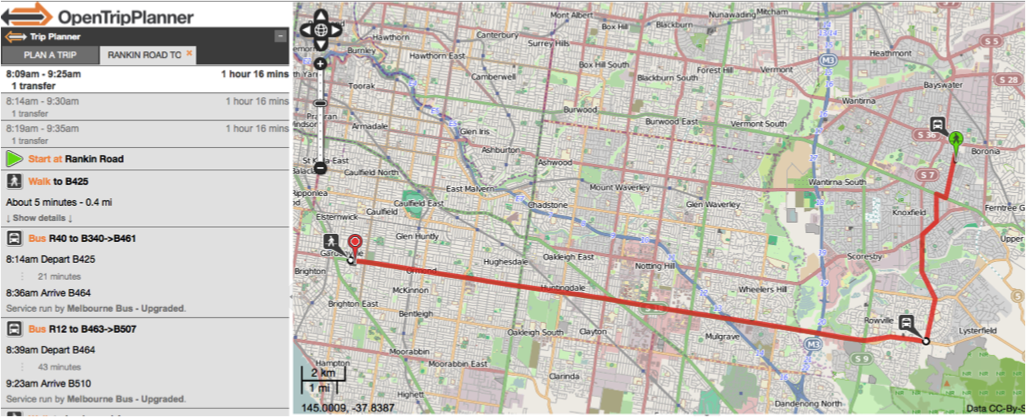
| 02:17, 23 March 2014 | EasternRoute-NewBZE Bus Network.png (file) |  |
782 KB | Re OSSTIP/WPBZE1 - example of a trip routed in OpenTripPlanner, using augmented BZE bus network in combination with Melbourne existing tram and train network. | 1 |
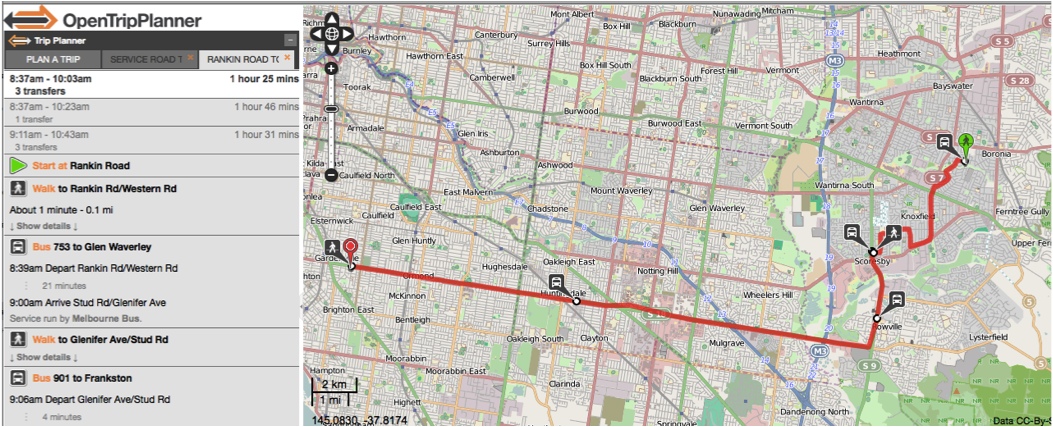
| 02:15, 23 March 2014 | EasternRoute-CurrentNetwork.png (file) |  |
857 KB | Re OSSTIP/WPBZE1 - example of a trip routed in OpenTripPlanner, using existing Melbourne PTV network. | 1 |
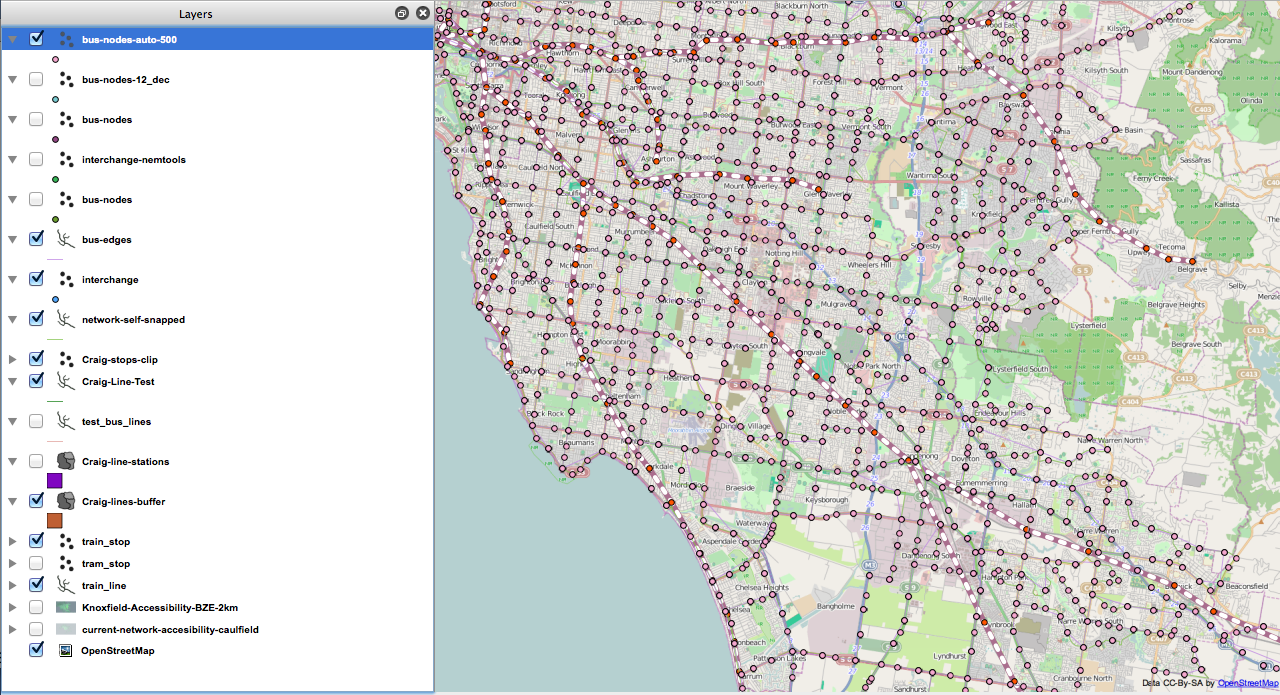
| 06:38, 21 March 2014 | BZE-BusStops-Auto-Side.png (file) |  |
1.04 MB | Re OSSTIP/WPBZE1 - bus stop placement, using auto stop generation at max 500m spacing, shown in QGIS. | 1 |
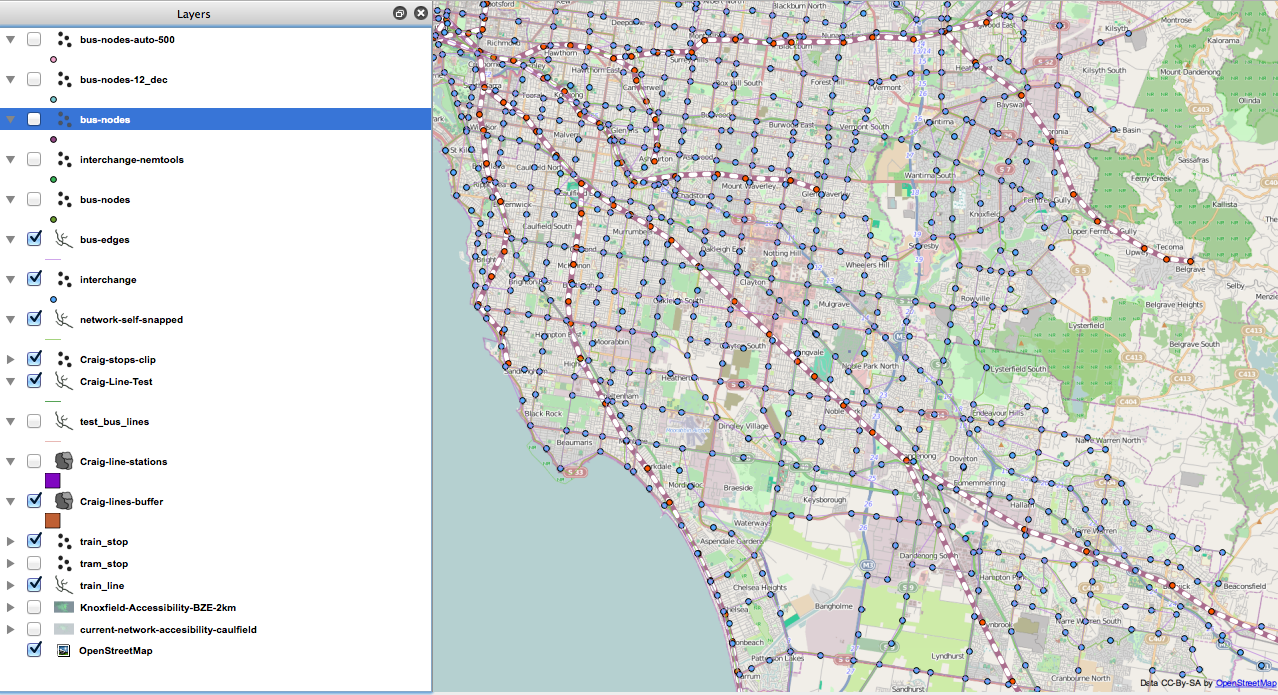
| 06:37, 21 March 2014 | BZE-BusStops-Manual-Side.png (file) |  |
1.06 MB | Re OSSTIP/WPBZE1 - bus stop placement, from manual QGIS work. | 1 |
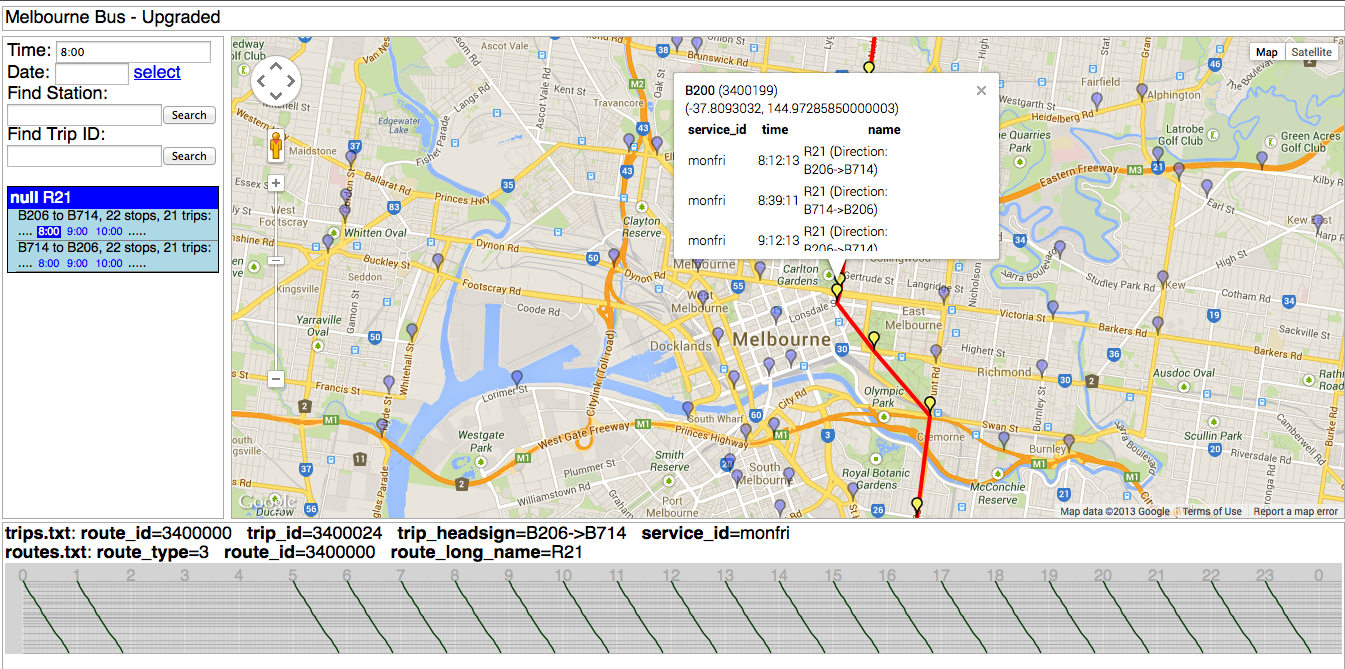
| 05:53, 21 March 2014 | ScheduleViewer-NetworkTests-2.png (file) |  |
483 KB | Per OSSTIP/WP5, an example of checking one route out of an entire converted GTFS schedule (being used in OSSTIP/WPBZE1). | 1 |
| 05:48, 21 March 2014 | ScheduleViewer-SingleBusRouteTesting.png (file) |  |
725 KB | Per OSSTIP/WP5 example of testing a GTFS conversion of a single bus route. | 1 |
| 05:42, 21 March 2014 | QGIS-CraigTest-CraigTestAndBusStops.png (file) |  |
264 KB | Sample relevant to OSSTIP/WP5 - managing stations and route route segments for GTFS conversion. | 1 |
| 07:10, 15 March 2014 | Pat-2012-MelbOpenGIS-faceShoulders.jpeg (file) |  |
94 KB | Pat Sunter picture, taken during Melb Open GIS meetup. | 1 |
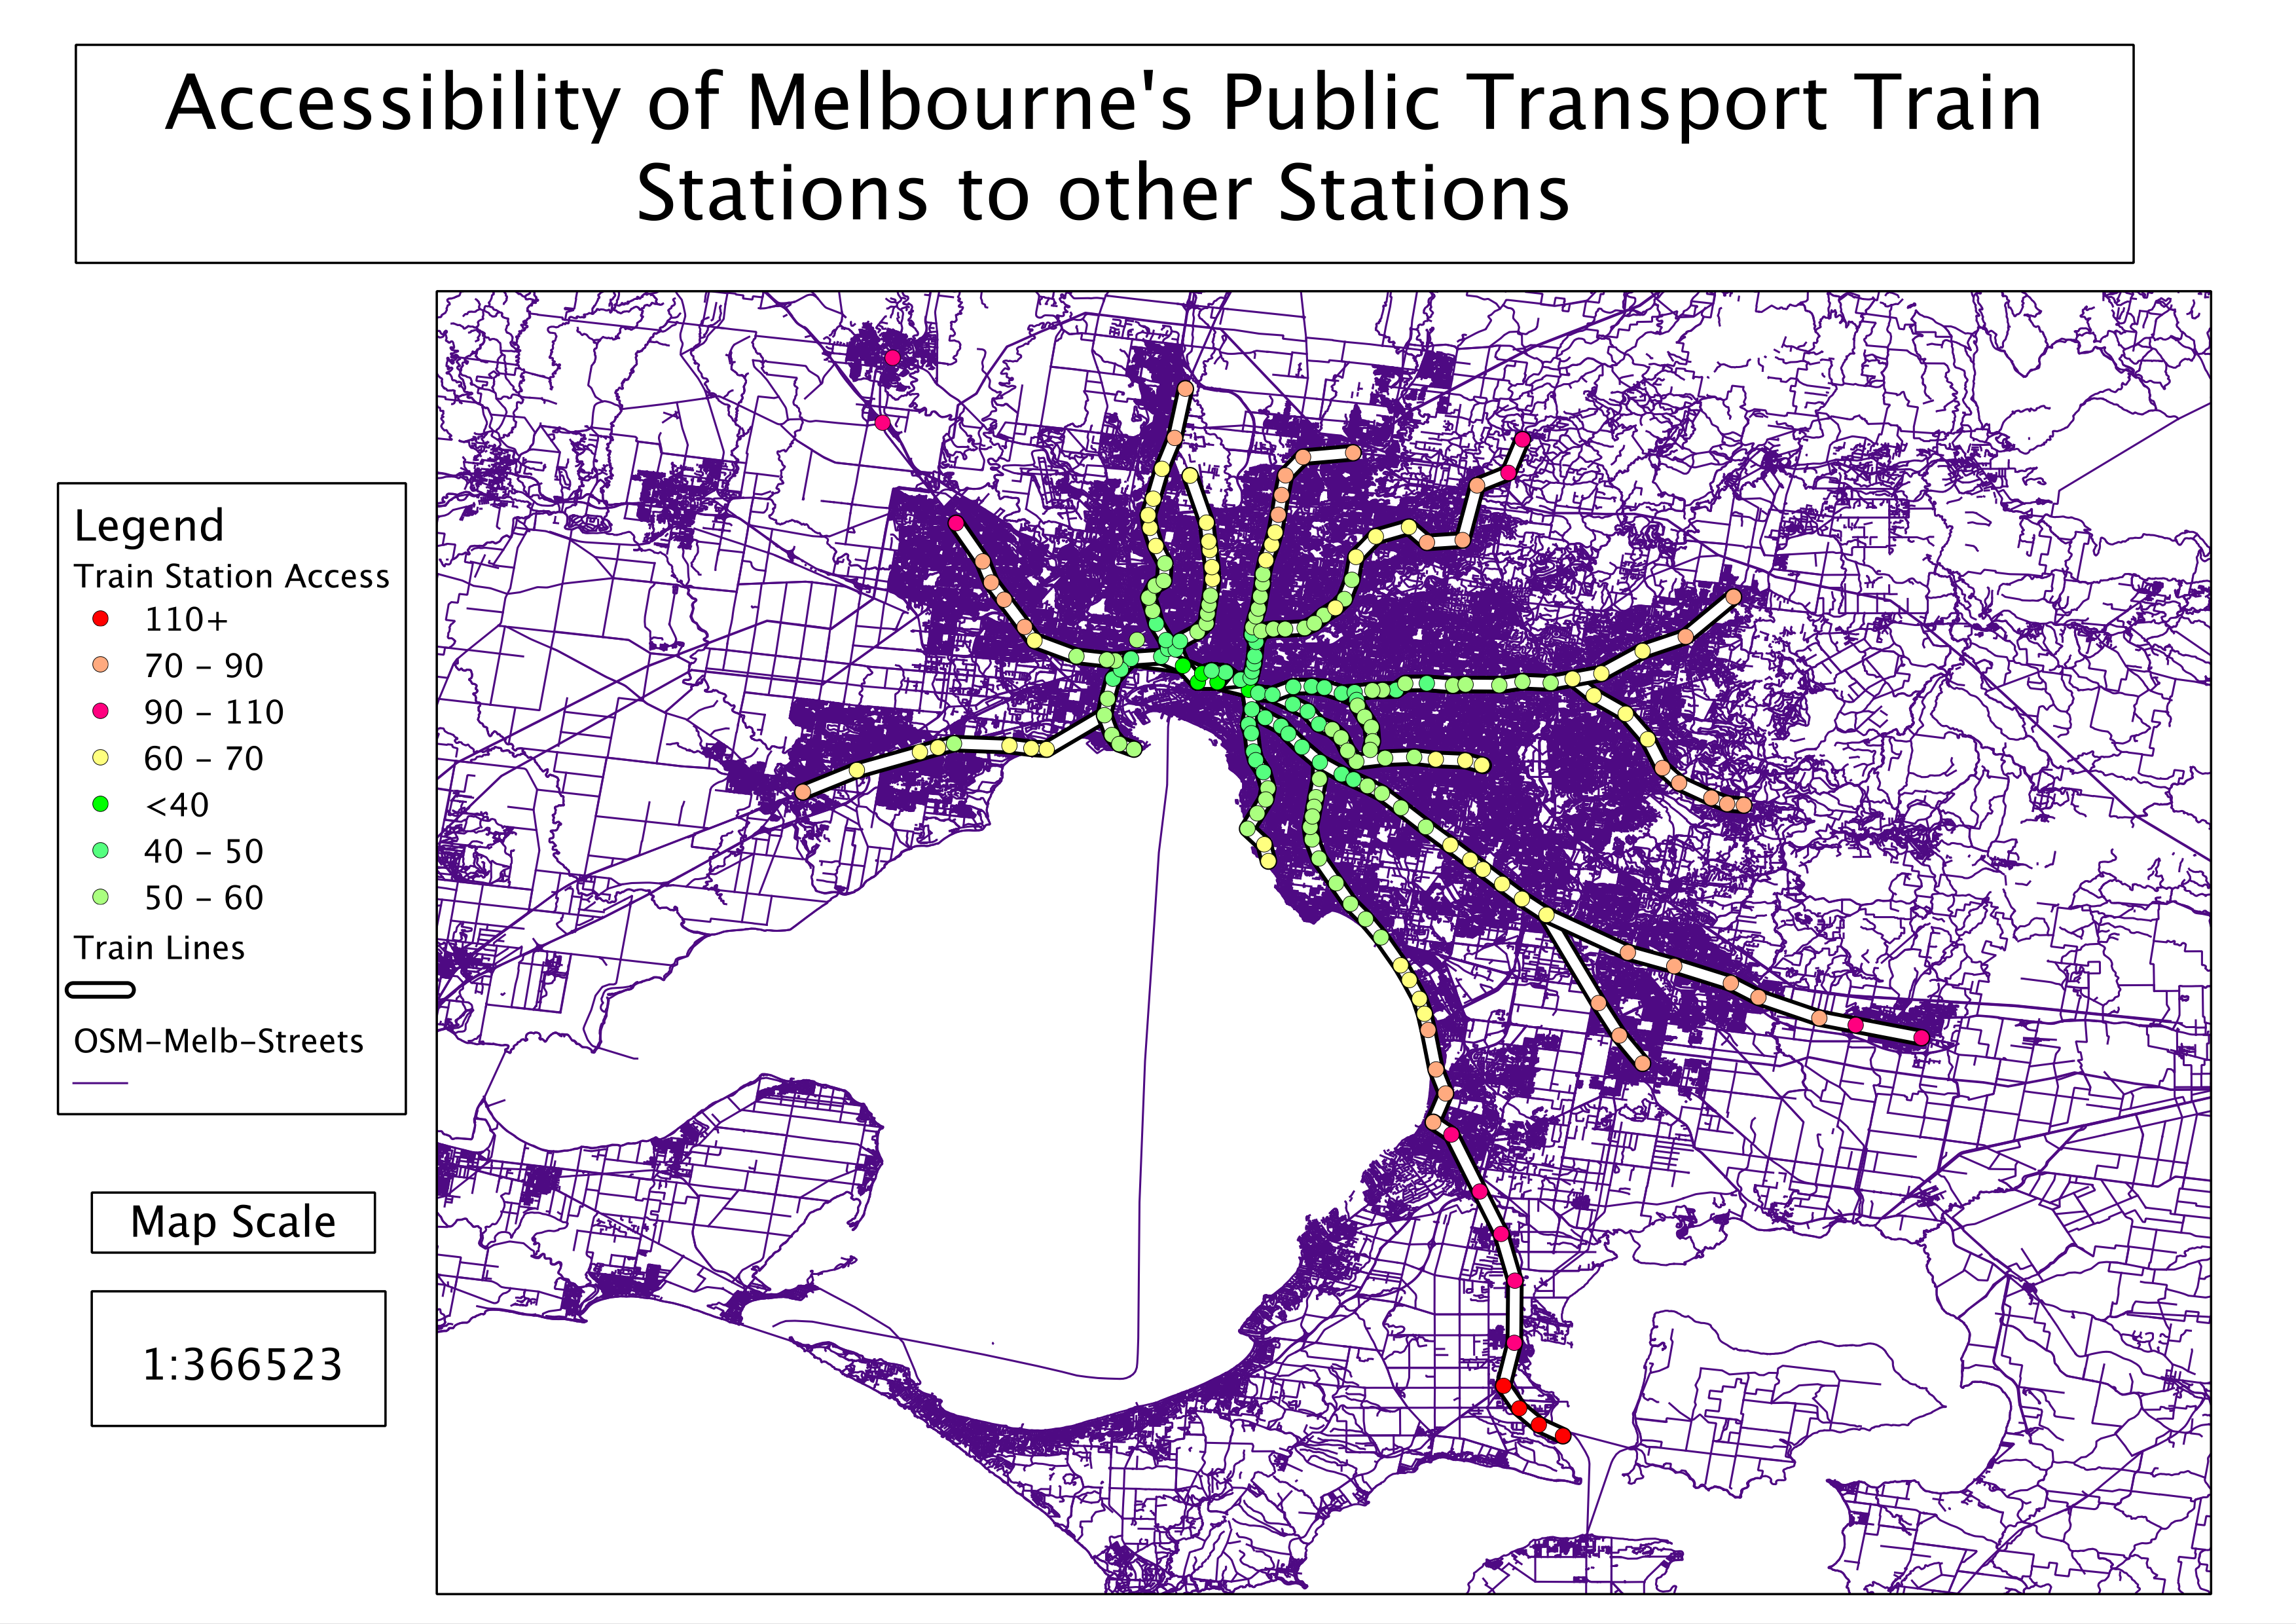
| 20:25, 28 August 2013 | QGIS-TrainStationAccess.png (file) |  |
3.26 MB | A visualisation of accessibility to Melbourne's train stations from other train stations - created using OpenTripPlanner and QGIS. | 1 |
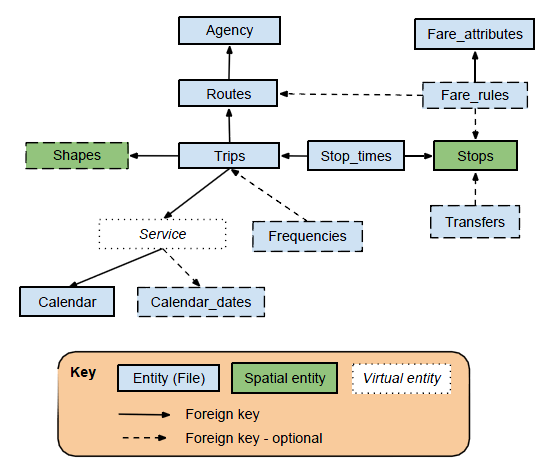
| 14:50, 25 July 2013 | GTFS data model diagram.PNG (file) |  |
34 KB | Data model of the GTFS file format, created by Martin Davis, as per blog post http://lin-ear-th-inking.blogspot.com.au/2011/09/data-model-diagrams-for-gtfs.html. Have permission to share on Appropedia (as per comment on that page). | 1 |
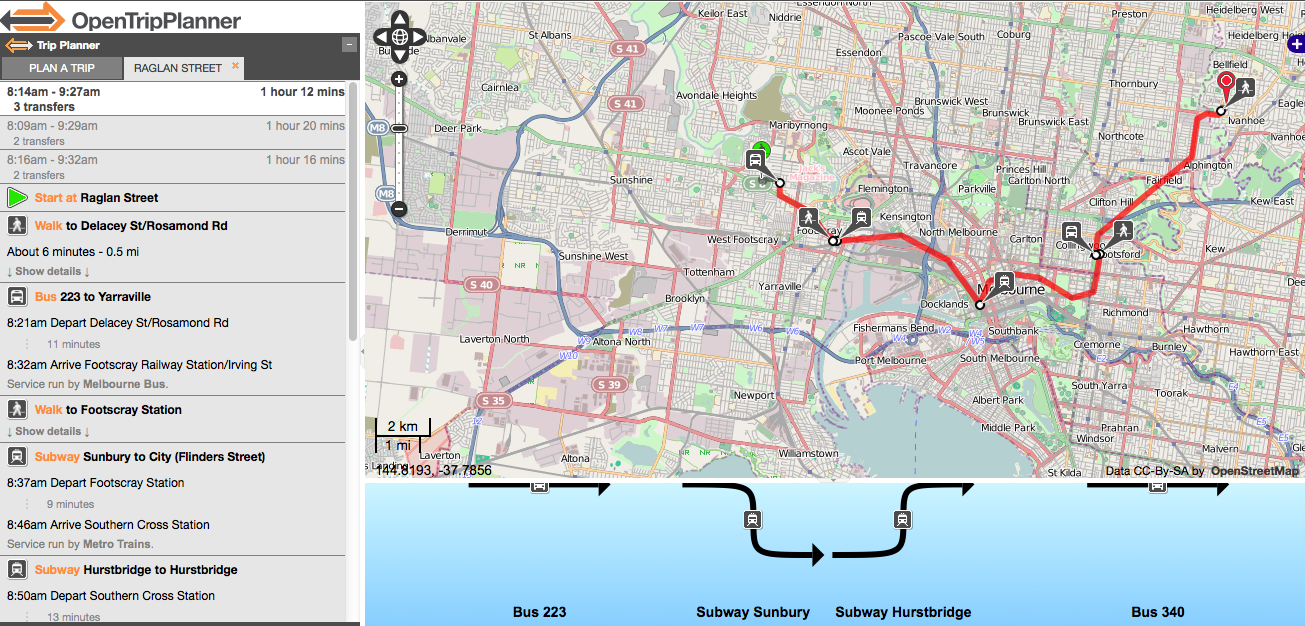
| 05:52, 18 July 2013 | OpenTripPlanner-RoutePlan-1.png (file) |  |
810 KB | A screenshot of using the OpenTripPlanner tool to test a route plan in Melbourne, Australia. (Created by user PatSunter as part of the OSSTIP project). | 1 |
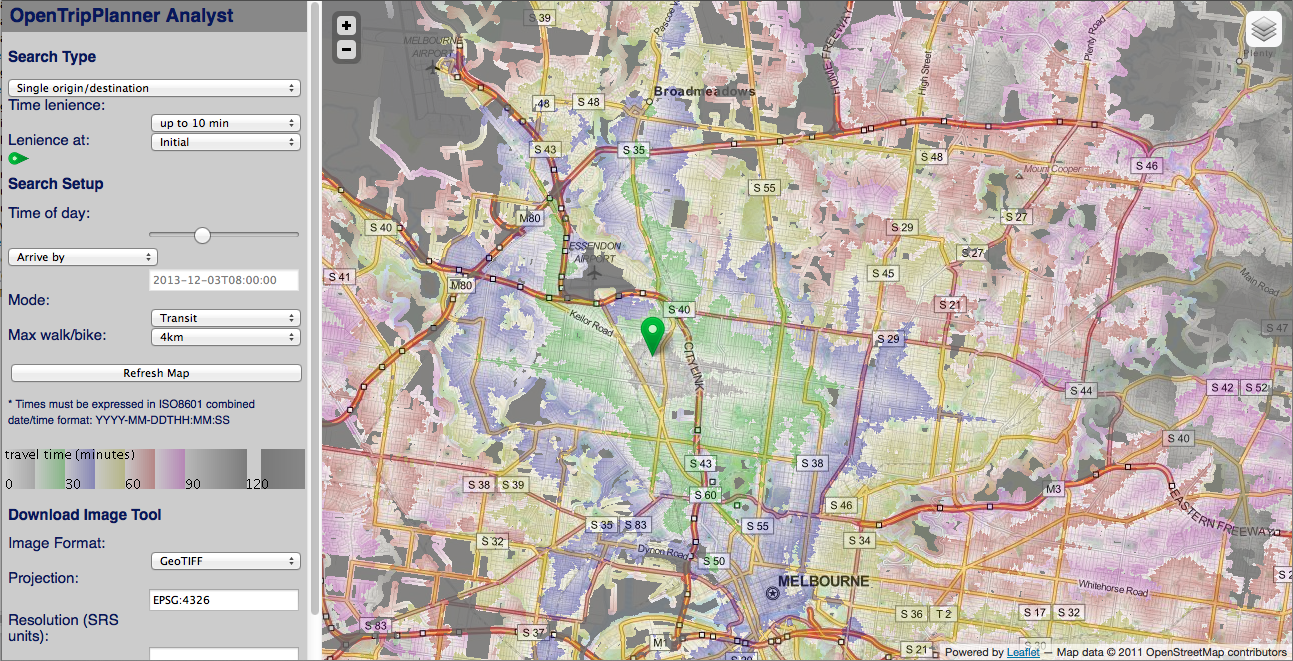
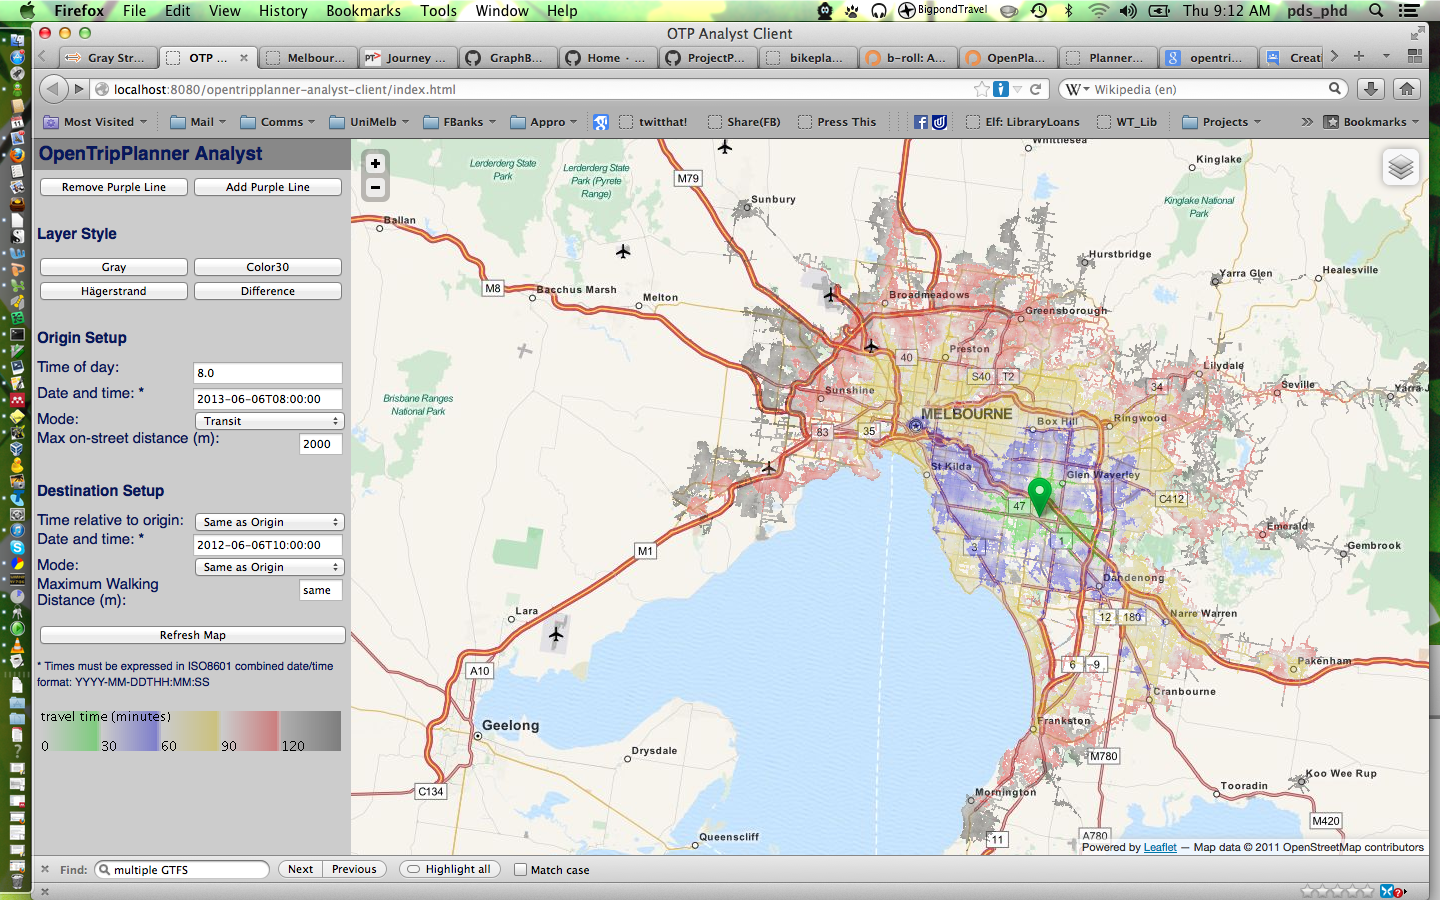
| 05:18, 18 July 2013 | Melbourne-IsoChrones-ToMonash-OTP-IncBus.png (file) |  |
1.26 MB | Using the OpenTripPlanner Analyst to calculate travel time isochrones to Monash Uni Clayton Campus in Melbourne, Australia. Created by user PatSunter as part of the OSSTIP project. | 1 |
| 05:08, 18 July 2013 | Google-ScheduleViewer-Trams-2.png (file) |  |
895 KB | Screenshot of using the ScheduleViewer tool to examine the tram network in Melbourne, Australia. Created by user PatSunter, while working on the OSSTIP project. | 1 |
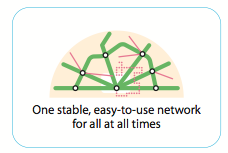
| 05:03, 18 July 2013 | HiTrans-ConnectedNetwork.png (file) | 18 KB | Picture of a concept of a connected integrated multimodal transport network, from HiTrans: Planning the Networks booklet. Nielsen, G., Nelson, J., Mulley, C., Tegnér, G., Lind, G., & Lange, T. 2005, Public transport - Planning the networks. HiTrans Best | 1 | |
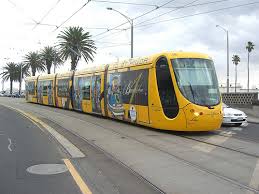
| 04:48, 18 July 2013 | MelbourneBumblebeeTram.jpg (file) |  |
9 KB | "Bumblebee 4" is seen on Melbourne's 96 St Kilda-East Brunswick service on Nov. 29, 2008. Photo by Flickr user avlxyz and used via Creative Commons license. Source: http://tramsstophere.wordpress.com/2010/10/12/melbourne-to-buy-mulhouse-bumblebee-trams/ | 1 |
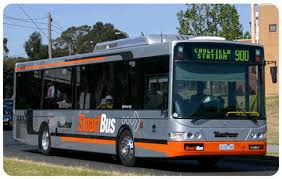
| 04:45, 18 July 2013 | SmartBus.jpg (file) |  |
11 KB | One of Melbourne's newer buses running one of the "SmartBus" routes. From http://www.pt4me2.org.au/better-buses . | 1 |
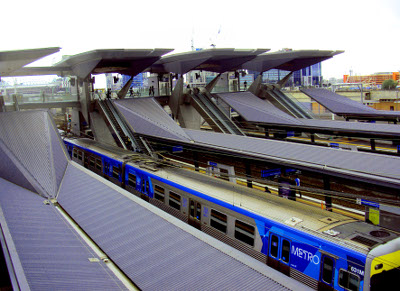
| 04:43, 18 July 2013 | North Melbourne Train Station 2-small.jpg (file) |  |
66 KB | This file is licensed under the Creative Commons Attribution-Share Alike 3.0 Unported license - by Flickr User "Voland b" | 1 |
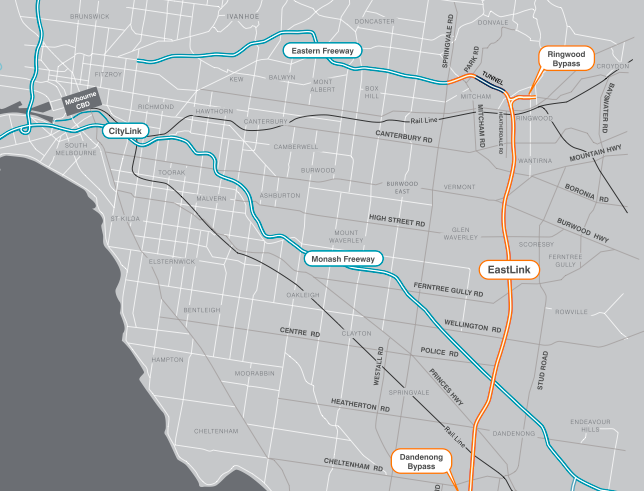
| 04:41, 18 July 2013 | Eastlink-MelbMotorwayMasterpiece-map.png (file) |  |
196 KB | A map showing the route of the new Eastlink, built in Melbourne, Australia in the 2000s. From the document "Eastlink: Melbourne's Motorway Masterpiece" (http://www.linkingmelbourne.vic.gov.au/pages/eastlink-publications.asp) | 1 |
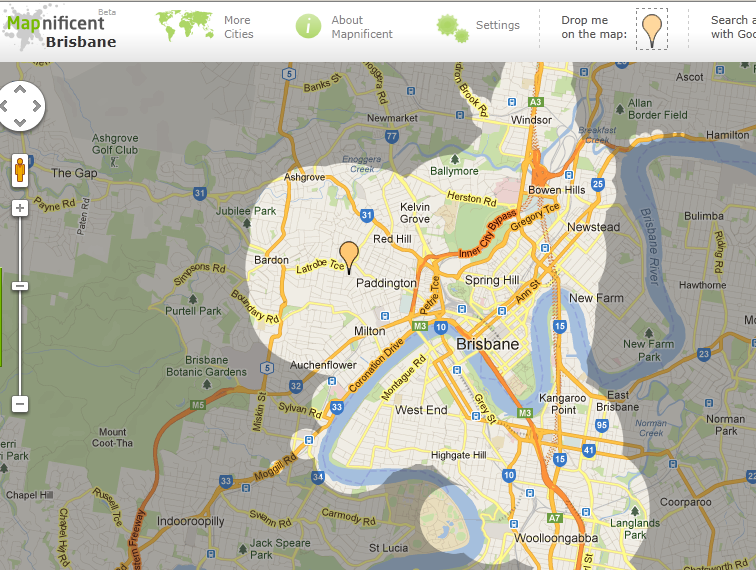
| 03:24, 6 May 2013 | Mapnificent-Bris.PNG (file) |  |
336 KB | Sample of an image produced by Mapnificent web service. Area shown is from Brisbane, Australia. | 1 |
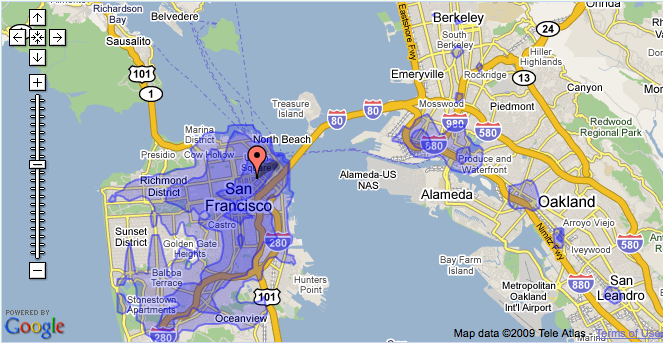
| 03:21, 6 May 2013 | Transittimewalkscore.png (file) | 240 KB | Image of the Graphserver software tool being used to generate Travel Time Maps, then displayed as part of the "Walkscore Transit" beta. | 1 | |
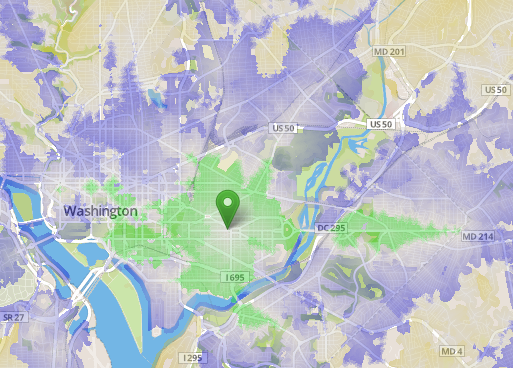
| 05:03, 21 April 2013 | DcTime2.png (file) |  |
262 KB | "Travel times from a point in central Washington, DC. Each color bands represents 30 minutes." generated using OpenTripPlanner software. Source: http://opentripplanner.com/2012/07/visualizing-urban-accessibility-with-opentripplanner-analyst | 1 |
| 01:46, 20 April 2013 | ExtendedUrbanMetabolicModel.gif (file) |  |
27 KB | Extended urban metabolism model for SoE reporting on human settlements. From 2001 Australian State of the Environemnt report, Newton et al, 2001 http://www.environment.gov.au/soe/2001/publications/theme-reports/settlements/introduction.html | 1 |
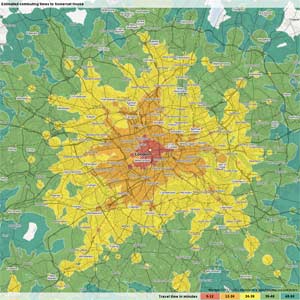
| 09:33, 19 April 2013 | SomersetHouse60mArr3pmZoom12.jpg (file) |  |
21 KB | Mapumental output showing "Public transport travel times to reach Somerset House in London by 3pm. " Source: shop.Mapumental.com According to Mapumental site terms, "The map images are provided under the Creative Commons CC-by-SA 3.0 licence." | 1 |
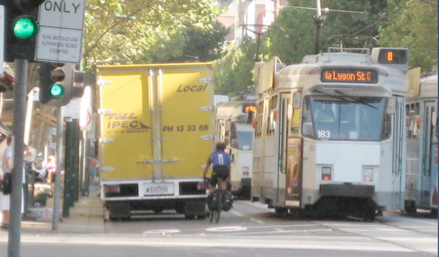
| 01:57, 15 March 2013 | GAMUT-TramBikes.png (file) |  |
191 KB | Pic of several trams and a bike competing for fair road-space with a truck. | 1 |