The Keweenaw Research Center is a research institute of Michigan Technological University. The KRC utilizes experienced full time staff and MTU faculty to provide engineering solutions to industries both foreign and domestic.
The KRC maintains two data sets that are extremely useful for solar photovoltaic modeling for this region of the upper peninsula of Michigan, which happens to be the second snowiest place in the entire U.S.:
Weather Data for the Keweenaw[edit | edit source]
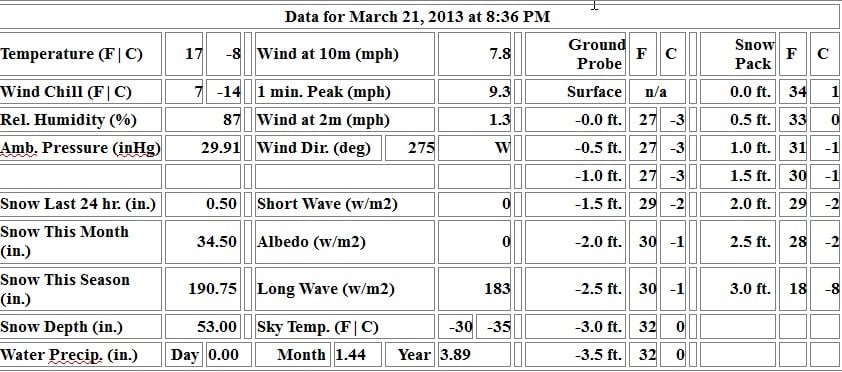
- KRC weather station - includes live, webcam and full archival weather data, for solar flux - Eppley PSPs not heated or aspirated. Note that the "Diffuse Solar" channel is actually recording albedo (upwelling radiation).
- KRC Weather Station Live Data and Webcams: KRC Met Station
- KRC Weather Station Archival Data Listing: Downloadable Archive Data
- These are ASCII comma-delimited text files with a header line for each column set up for direct import into Libre Office/ Excel. See the "00_README.txt" file located there for more information on how the data is collected and the sensors that were used. The current days data file is uploaded to the web site at 23:59 each day and each file contains a single days worth of data. Sort on "Last Modified" for chronological order.
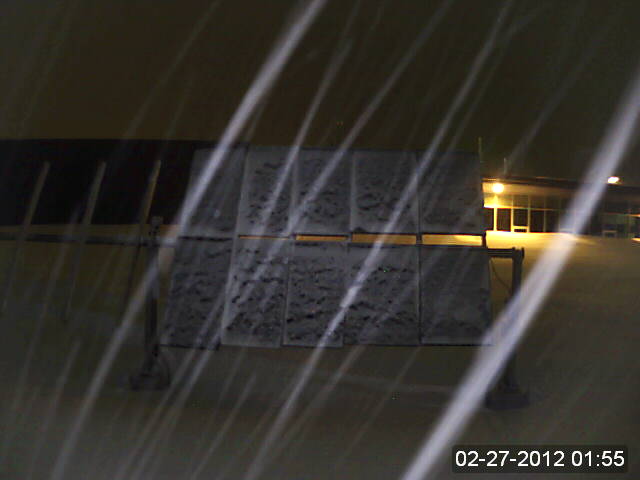
- Scraped photos of arrays http://opensource.mtu.edu/snow/krc_panels/
Solar Photovoltaic Performance Data for the Keweenaw[edit | edit source]
| Solar Panel Timelapse of Snow Accumulation and Melt-Off over Five Days at the KRC |
|---|
- KRC/MTSPRF Photovoltaic Panel Data Links & Archives -- Controls and MicroInverters Provided Courtesy of SolarBridge Technologies, Photovoltaic Panels and Mounts Provided Courtesy of Dow Corning, Hemlock Semiconductor and Patriot Solar Group
- KRC solar array tilt angle history
- Also a download location for the KRC Met Station Webcam images down near the bottom: “KRC Met Station Webcam Archival Images Listing:”. Camera image saved every 15 min.
- Solar Panel Webcam Archival Images Listing: Downloadable Archive Images
- MTSPRF Dedication Photos: List of Photos
- KRC solar calculator - http://web.archive.org/web/20160325153053/http://solarizehoughton.org/solar-calculator/
- http://web.archive.org/web/20160414035848/http://solarizehoughton.org:80/resources/
Solarvortimac[edit | edit source]
Solar.vortimac is a data stream from an 8.2kW ground mounted PV array in Houghton. The ribbon across the bottom of the page allows you to change the "days to display" to select the number of days to go back from the current date, and either 5-Minute or Daily intervals. There is also a "refresh" button to see the results plotted (though for hourly data, anything more than a few days won't render - it's mostly for daily plotting), and the "Export CSV" button on the far right will download the CSV file to your computer. You can download the csv using http://web.archive.org/web/20140630064309/http://solar.vortimac.com:80/data/export.php?days=365&timeframe=false , change days for the number of days you want data.
Note: Data before March 13, 2013 is unreliable and needs to be manually screened.
- The format of the CSV file for hourly data is: Avg Power (watts), Lifetime Energy (watt hours), Time
- The format of the CSV file for daily data is simply: Energy (watt hours), Date
Houghton residential PV data[edit | edit source]
- A snapshot of some historical PV data in Houghton [1]
- Houghton weather data sets, solar flux:
- Magnetic declination http://www.ngdc.noaa.gov/geomag-web/#declination
Using the KRC[edit | edit source]
The students must complete a written hazard analysis in advance of these types of activities and then have that hazard analysis reviewed and approved by Dr. Pearce. A hazard analysis would have addressed the following concerns that have come up in discussion since the activity:
- PPE. - Spill control. - Eyewash access. - Turned off and locked out. - 1) KRC staff must be present 2) an index number to charge time must be provided, 3) SDS's for ALL chemicals brought to the site must be provided IN ADVANCE, 4) a clear scope of work must be provided and 5) a specific time must be agreed upon for the activity.


