Appendix A. Raw data: The raw data collected from each of our testing locations were recorded in Table A-1 and A-2. The columns represent the parameters that were recorded in the field, as well as in lab experiments such as salinity, turbidity, and TSS. The rows are color coordinated to represent the week of testing done, red for week one, yellow for week two, blue for week three, and green for week four. During week two, the TSS column for both Tables A-1 and A-2 have red highlighted cells to indicate errors made during the TSS experiment. Our team had discussed it was most likely a tabulation error during the initial weighing of the crucible and filter. All values inside of the cells are corrected to the proper decimal place.
Table A-0: Contextual data for Tables A-1 and A-2, indicating date and approximate time, as well as qualitative observations of the atmospheric conditions during sampling. The color coding is consistent with Tables A-1 and A-2; therefore, Collection Week 1 corresponds to the salmon colored rows, Collection Week 2 corresponds to yellow, and so on.
| Collection Week | Date | Time | Field Notes | Environment Temp. (°C) |
| 1 | 2022-Oct-13 | 1330 to 1345 (sample retrieval) | parameters were recorded earlier than sample retrieval, at approx. 0530. | 13.8999 |
| 2 | 2022-Oct-18 | 1800-1900 | Fog rolling in as samples were taken | 13.33 |
| 3 | 2022-Oct-25 | 1800-1845 | Clear skies | 12.22 |
| 4 | 2022-Nov-01 | 1800-1847 | Just rained, higher water level | 10.5 |
Table A-1: Raw data for all parameters before the confluence. Boxes in bright red indicate values not being used in analysis due to inaccuracy in data collection or analysis.
| Meters | In-lab experiments for TSS | |||||||||||
| DO | DO | Temp. | Specific Conductivity (temp. corrected) | pH | Salinity | Turbidity | Tray ID | Weight of crucible + filter | Sample volume filtered | Weight of crucible + filter + residue after 24 hours at 105 C | TSS | Corrected TSS |
| (mg/L) | (% Sat) | (°C) | (µS/cm) | (ppt) | (NTUs) | (g) | (mL) | (g) | (mg/L) | (mg/L) | ||
| 9.10 | 91.0 | 12.3 | 0.0 | 6.93 | 0.1 | 16.0 | u1 | 22.5193 | 140 | 22.5215 | 15.7 | 15.7 |
| 9.30 | 96.0 | 12.2 | 0.0 | 6.97 | 0.1 | 15.0 | u2 | 23.6089 | 134 | 23.6113 | 17.9 | 17.9 |
| 9.30 | 97.0 | 12.4 | 0.0 | 6.99 | 0.1 | 17.0 | u3 | 25.3985 | 141 | 25.4027 | 29.8 | 29.8 |
| 6.78 | 62.0 | 12.6 | 0.0 | 6.78 | 0.1 | 7.1 | u1 | 24.3281 | 250 | 24.3311 | 12.0 | 12.0 |
| 6.85 | 60.0 | 12.6 | 0.0 | 6.85 | 0.1 | 7.2 | u2 | 21.5877 | 270 | 21.5026 | -315.2* | 0.0 |
| 6.88 | 59.0 | 12.5 | 0.0 | 6.88 | 0.1 | 6.8 | u3 | 21.4998 | 225 | 21.6106 | 492.4* | 492.4 |
| 1.30 | 11.0 | 11.4 | 0.0 | 6.60 | 0.1 | 17.3 | u1 | 23.629 | 96 | 23.6297 | 7.3 | 7.3 |
| 1.20 | 10.0 | 11.4 | 0.0 | 6.58 | 0.1 | 16.0 | u2 | 22.4467 | 116 | 22.4472 | 4.3 | 4.3 |
| 0.70 | 6.0 | 11.3 | 0.0 | 6.62 | 0.1 | 16.5 | u3 | 23.1765 | 92 | 23.1777 | 13.0 | 13.0 |
| 1.30 | 12.0 | 10.8 | 0.0 | 6.38 | 0.1 | 23.7 | u1 | 22.445 | 90 | 22.4506 | 62.2 | 62.2 |
| 1.50 | 14.0 | 10.8 | 0.0 | 6.37 | 0.1 | 20.5 | u2 | 22.5186 | 91 | 22.5201 | 16.6 | 16.6 |
| 1.20 | 11.0 | 10.8 | 0.0 | 6.29 | 0.1 | 20.1 | u3 | 21.5633 | 89 | 21.5657 | 27.0 | 27.0 |
Table A-2: Raw data for all parameters after the confluence.
| Meters | In-lab experiments for TSS | |||||||||||
| DO | DO | Temp. | Specific Conductivity (temp. corrected) | pH | Salinity | Turbidity | Tray ID | Weight of crucible + filter | Sample volume filtered | Weight of crucible + filter + residue after 24 hours at 105 C | TSS | Corrected TSS |
| (mg/L) | (% Sat) | (°C) | (µS/cm) | (ppt) | (NTUs) | (g) | (mL) | (g) | (mg/L) | (mg/L) | ||
| 9.00 | 94.0 | 12.4 | 0.0 | 6.92 | 0.1 | 5.6 | d1 | 19.7495 | 346 | 19.7522 | 7.8 | 7.8 |
| 9.40 | 96.0 | 12.6 | 0.0 | 6.92 | 0.1 | 5.5 | d2 | 23.6272 | 325 | 23.6294 | 6.8 | 6.8 |
| 9.20 | 95.0 | 12.6 | 0.0 | 6.97 | 0.1 | 5.5 | d3 | 23.2769 | 370 | 23.2791 | 5.9 | 5.9 |
| 10.80 | 100.0 | 12.0 | 0.0 | 6.94 | 0.1 | 4.2 | d1 | 17.9431 | 456 | 17.9456 | 5.5 | 5.5 |
| 10.90 | 100.0 | 12.0 | 0.0 | 7.00 | 0.1 | 4.0 | d2 | 23.4981 | 450 | 22.4477 | -2334.2 | 0.0 |
| 10.80 | 99.0 | 12.0 | 0.0 | 7.90 | 0.1 | 4.0 | d3 | 20.2653 | 500 | 19.2546 | -2021.4 | 0.0 |
| 9.60 | 87.0 | 11.2 | 0.0 | 6.86 | 0.1 | 5.1 | d1 | 19.2544 | 321 | 19.2552 | 2.5 | 2.5 |
| 9.60 | 86.0 | 11.2 | 0.0 | 6.95 | 0.1 | 5.6 | d2 | 25.4004 | 320 | 25.401 | 1.9 | 1.9 |
| 9.70 | 87.0 | 11.2 | 0.0 | 6.99 | 0.1 | 4.7 | d3 | 21.4870 | 307 | 21.4879 | 2.9 | 2.9 |
| 6.40 | 58.0 | 10.5 | 0.0 | 6.48 | 0.1 | 13.5 | d1 | 19.1764 | 142 | 19.1775 | 7.7 | 7.7 |
| 6.40 | 57.0 | 10.5 | 0.0 | 6.35 | 0.1 | 12.5 | d2 | 22.6715 | 608 | 22.672 | 0.8 | 0.8 |
| 6.30 | 57.0 | 10.5 | 0.0 | 6.32 | 0.1 | 12.9 | d3 | 23.6277 | 130 | 23.6288 | 8.5 | 8.5 |
*Boxes in bright red indicate values not being used in analysis due to inaccuracy in data collection or analysis.
Appendix B. Intermediate results[edit | edit source]
This Appendix presents the results of intermediate calculations used to produce the final analysis. These values were also used to produce the box-and-whiskers plots shown in Results. The table has been split up into two parts in an attempt to improve legibility; Table B-1A contains average and sample size, while Table B-1B contains standard deviation and standard error. Table B-1A: Average and Sample Size of each parameter, upstream and downstream.
| Average | Sample Size | |||||||
| Collection Week >>> | 1 | 2 | 3 | 4 | 1 | 2 | 3 | 4 |
| DO (mg/L) | ||||||||
| Upstream (T4Q) | 9.20 | 6.84 | 1.07 | 1.33 | 3.00 | 3.00 | 3.00 | 3.00 |
| Downstream (T4L) | 9.20 | 10.83 | 9.63 | 6.37 | 3.00 | 3.00 | 3.00 | 3.00 |
| Temp. (°C) | ||||||||
| Upstream (T4Q) | 12.3 | 12.6 | 11.4 | 10.8 | 3.0 | 3.0 | 3.0 | 3.0 |
| Downstream (T4L) | 12.5 | 12.0 | 11.2 | 10.5 | 3.0 | 3.0 | 3.0 | 3.0 |
| Specific Conductivity (µS/cm) | ||||||||
| Upstream (T4Q) | 0 | 0 | 0 | 0 | 0 | 0 | 0 | 0 |
| Downstream (T4L) | 0 | 0 | 0 | 0 | 0 | 0 | 0 | 0 |
| pH | ||||||||
| Upstream (T4Q) | 6.96 | 6.84 | 6.60 | 6.35 | 3.00 | 3.00 | 3.00 | 3.00 |
| Downstream (T4L) | 6.94 | 7.28 | 6.93 | 6.38 | 3.00 | 3.00 | 3.00 | 3.00 |
| Salinity (ppt) | ||||||||
| Upstream (T4Q) | 0.1 | 0.1 | 0.1 | 0.1 | 3 | 3 | 3 | 3 |
| Downstream (T4L) | 0.1 | 0.1 | 0.1 | 0.1 | 3 | 3 | 3 | 3 |
| Turbidity (NTUs) | ||||||||
| Upstream (T4Q) | 16.00 | 7.03 | 16.60 | 21.43 | 3.00 | 3.00 | 3.00 | 3.00 |
| Downstream (T4L) | 5.53 | 4.07 | 5.13 | 12.97 | 3.00 | 3.00 | 3.00 | 3.00 |
| TSS (mg/L) | ||||||||
| Upstream (T4Q) | 21.14 | 12.00 | 8.22 | 35.25 | 3.00 | 1.00 | 3.00 | 3.00 |
| Downstream (T4L) | 6.84 | 5.48 | 2.43 | 5.68 | 3.00 | 1.00 | 3.00 | 3.00 |
Table B-1B: Standard Deviation and Standard Error of each parameter, upstream and downstream.
| Standard Deviation | Standard Error | ||||||||
| Collection Week >>> | 1 | 2 | 3 | 4 | 1 | 2 | 3 | 4 | |
| DO (mg/L) | |||||||||
| Upstream (T4Q) | 0.12 | 0.05 | 0.32 | 0.15 | 0.07 | 0.03 | 0.19 | 0.09 | |
| Downstream (T4L) | 0.20 | 0.06 | 0.06 | 0.06 | 0.12 | 0.03 | 0.03 | 0.03 | |
| Temp. (°C) | |||||||||
| Upstream (T4Q) | 0.1 | 1.5 | 0.1 | 0.0 | 0.0 | 0.0 | 1.5 | 0.0 | |
| Downstream (T4L) | 0.1 | 0.0 | 0.0 | 0.0 | 0.0 | 0.0 | 0.0 | 0.0 | |
| Specific Conductivity (µS/cm) | |||||||||
| Upstream (T4Q) | 0 | 0 | 0 | 0 | 0 | 0 | 0 | 0 | |
| Downstream (T4L) | 0 | 0 | 0 | 0 | 0 | 0 | 0 | 0 | |
| pH | |||||||||
| Upstream (T4Q) | 0.03 | 0.05 | 0.02 | 0.05 | 0.02 | 0.03 | 0.01 | 0.03 | |
| Downstream (T4L) | 0.03 | 0.54 | 0.07 | 0.09 | 0.02 | 0.31 | 0.04 | 0.05 | |
| Salinity (ppt) | |||||||||
| Upstream (T4Q) | 0 | 0 | 0 | 0 | 0 | 0 | 0 | 0 | |
| Downstream (T4L) | 0 | 0 | 0 | 0 | 0 | 0 | 0 | 0 | |
| Turbidity (NTUs) | |||||||||
| Upstream (T4Q) | 1.00 | 0.21 | 0.66 | 1.97 | 0.58 | 0.12 | 0.38 | 1.14 | |
| Downstream (T4L) | 0.06 | 0.12 | 0.47 | 0.50 | 0.03 | 0.07 | 0.27 | 0.29 | |
| TSS (mg/L) | |||||||||
| Upstream (T4Q) | 7.57 | 0.00 | 4.44 | 23.93 | 4.37 | 0.00 | 2.56 | 13.81 | |
| Downstream (T4L) | 0.93 | 0.00 | 0.53 | 4.22 | 0.54 | 0.00 | 0.31 | 2.44 | |
Table B-2. Median, max., min, and sample size for DO (mg/L), specific conductivity (µS/cm), pH, salinity (ppt), turbidity (NTUs), and TSS (mg/L) for each site, across all sampling days.
| Median | Max. | Min. | Sample Size | |
| DO (mg/L) | ||||
| Upstream (T4Q) | 4.14 | 9.30 | 0.70 | 12 |
| Downstream (T4L) | 9.50 | 10.90 | 6.30 | 12 |
| Temp. (°C) | ||||
| Upstream (T4Q) | 11.8 | 12.6 | 10.8 | 12 |
| Downstream (T4L) | 11.6 | 12.6 | 10.5 | 12 |
| Specific Conductivity (µS/cm) | ||||
| Upstream (T4Q) | 0 | 0 | 0 | 0 |
| Downstream (T4L) | 0 | 0 | 0 | 0 |
| pH | ||||
| Upstream (T4Q) | 6.70 | 6.99 | 6.29 | 12 |
| Downstream (T4L) | 6.93 | 7.90 | 6.32 | 12 |
| Salinity (ppt) | ||||
| Upstream (T4Q) | 0.1 | 0.1 | 0.1 | 12 |
| Downstream (T4L) | 0.1 | 0.1 | 0.1 | 12 |
| Turbidity (NTUs) | ||||
| Upstream (T4Q) | 16.3 | 23.7 | 6.8 | 12 |
| Downstream (T4L) | 5.5 | 13.5 | 4.0 | 12 |
| TSS (mg/L) | ||||
| Upstream (T4Q) | 16.1 | 62.2 | 4.3 | 10 |
| Downstream (T4L) | 5.7 | 8.5 | 0.8 | 10 |
Appendix C. Previous data collection[edit | edit source]
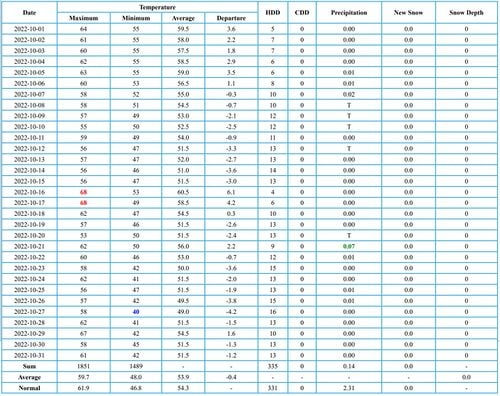
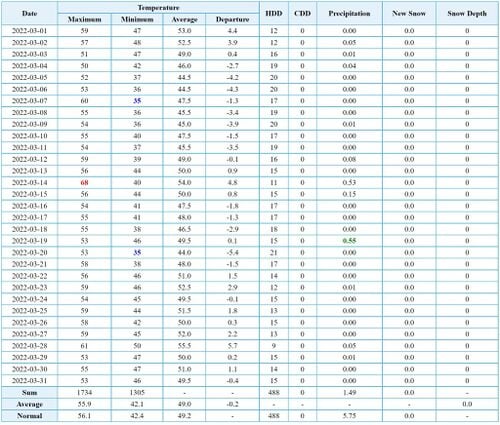
Since the other two groups sampling from Janes Creek in October did not have access to any previous data, none is included in this analysis. However, meteorological data is available for the months of March and October, and provides context that may explain certain patterns, such as the variation in DO vs. temp.
Table C-1: Weather for Eureka area during the month of October (NOAA 2022).
Table C-2: Weather for Eureka area during the month of March (NOAA 2022)
Sample calculations[edit | edit source]
Sample calculations values for average, standard deviation, and standard error are taken from week one of the upstream location for temperature. The sample calculation for TSS uses data collected from week one of the upstream location for sample u1.
- Average=∑data/n (1) where n = sample size Average=(12.3+12.2+12.4)℃3 Average=12.3℃
- Standard Deviation: =(x-)2n (2) Where x=data point, =mean Standard Deviation: =(12.3-12.3)2+(12.2-12.3)2+(12.4-12.3)23 =0.1
- Standard Error: SE=n (3) SE=0.13 SE=0.06
- TSS=(Mass of crucible after filtration- Mass of crucible before filtration)grams1000 (Volume of sample filtered)mL1000 (4) TSS=(22.5215g-22.5193g)*1000140mL TSS=15.7


