
Influence of Janes Creek South Fork Confluence on Main Stem
The Janes Creek watershed is located in Arcata, California (Figure 2-1). The two sampling locations used to study this section of Janes Creek are denoted as T4Q and T4L by the City of Arcata.
The upstream site, T4Q (Figure 2-3) is located before the confluence across the street from the West End Road Ridge Trail parking lot, where the South Fork of Janes Creek meets the main stem. The site is located on the north side of the road between the industrial buildings and main road, downstream of an industrial logging operation (Figure 2-2). Here, it crosses under the road through a culvert, meeting with site T4L (Figure 2-4). T4L is located after the confluence, east of the bridge and north of the Camp Curtis Apartments. These sites were chosen for this study based on public access, accessibility, and proximity to the confluence.

Before the confluence, Janes Creek runs through residential areas and along West End Road. Sediment and other particles from the road and residential areas are likely entering the stream up until this point, affecting the amount of solids present, especially following a rain event. The south fork of Janes Creek runs through forested land until it meets the main stem at the confluence. Due to the difference in land cover type, the south fork of Janes Creek likely has different environmental inputs than the main stem. Because soils under natural forest tend to be relatively porous with high infiltration rates, forest cover often lowers the rates of runoff compared to non-forested land (Hümann et al. 2011). Therefore, although runoff of soils and other particles could occur following a rain event, there may be overall less particulate matter entering the south fork than there would be for the stream section along the main road.
The objective of this project is to determine the impact of the forested Janes Creek south fork on the water quality of the Janes Creek main stem after the confluence, with relation to dissolved oxygen (mg/L), temperature (°C), specific conductivity (μS/cm), pH, salinity (ppt), turbidity (NTU), and TSS (mg/L). Due to the differing land cover types between the main stem before the confluence and the south fork, the confluence may have an impact on some water quality parameters, thus affecting a habitat suitable for salmonids.
-
 Figure 2-2. Lumber yard and facility near sampling sites (ESRI (basemap), Humboldt County GIS).
 -
 Figure 2-3. Upstream sampling site (T4Q).
 -
 Figure 2-4. Downstream sampling site (T4L).


Results
[edit | edit source]In October 2022, we tested multiple parameters at the sampling locations before and after the confluence over a four week period. Dissolved oxygen (Figure 2-5), temperature (Figure 2-6), specific conductivity (Figure 2-7), pH (Figure 2-8), salinity (Figure 2-9), turbidity (Figure 2-10), and TSS (Figure 2-11) were all recorded once per week over the four week sampling period. Some values were not taken into account in this analysis. The TSS values were negative for the samples collected at both locations on 10/8/2022 (Appendices A-1, A-2). This should not be possible, and it indicates an error in sample weighing or data entry. We can therefore consider them to be outliers, and these values were not included in our statistical analysis. Additionally, the conductivity values were consistently read as 0 µS/cm (Figure 2-7). This may be an in-field instrument error, as the March conductivity readings range from the upper sixties through the lower nineties, which is higher than our readings of 0 µS/cm. Although the 0 µS/cm were included in the analysis, it should be noted that these values may not be accurate.
-
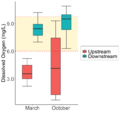 Figure 2-5. Dissolved oxygen in mg/L for both the upstream and downstream sampling locations in March 2022 and October 2022. There is a sample size of 12 for both the upstream and downstream locations in March and October. The top whiskers indicate the maximum value, while the bottom whiskers indicate the minimum value. The line through the middle of each box represents the median value. The yellow box represents the healthy range for adult salmonids, which ranges from 6.5 mg/L and 9.75 mg/L for adult, embryonic, and larval stages of salmonids (EPA 1986, Carter 2005). The ranges for October are: max=9.30 and 10.9, min= 0.70 and 6.30, median= 4.14 and 9.50. The ranges for March are: max=5.2 and 10.2, min=2.2 and 7.0, median=3.6 and 8.5.
 -
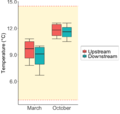 Figure 2-6. Temperature in °C for both the upstream and downstream sampling locations in March 2022 and October 2022. There is a sample size of 12 for both the upstream and downstream locations in March and October. The top whiskers indicate the maximum value, while the bottom whiskers indicate the minimum value. The line through the middle of each box represents the median value. The yellow box represents the healthy range for juvenile and adult coho and steelhead salmon, which is between 4.5 - 14.5°C (Bell 1986). The ranges for October are: max=12.6 and 12.6,min=10.8 and 10.5,median=11.8 and 11.6. The ranges for March are: max=10.8 and 10.0, min=7.8 and 6.7, median=9.7 and 9.1.
 -
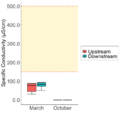 Figure 2-7. Specific conductivity in µS/cm for both the upstream and downstream sampling locations in March 2022 and October 2022. All October specific conductivity values were 0.0 µS/cm. There is a sample size of 12 for both the upstream and downstream locations in March, and a sample size of 0 for both the upstream and downstream locations in October. The top whiskers indicate the maximum value, while the bottom whiskers indicate the minimum value. The line through the middle of each box represents the median value. The yellow box represents the healthy range for adult salmonids, which is between 150 mg/L and 500 mg/L (EPA 2012). The ranges for March are: max=89.49 and 94.4, min=31.4 and 51.0, median=77.3 and 82.2.
 -
 Figure 2-8. pH for both the upstream and downstream sampling locations in March 2022 and October 2022. There is a sample size of 12 for both the upstream and downstream locations in March and October. The top whiskers indicate the maximum value, while the bottom whiskers indicate the minimum value. The line through the middle of each box represents the median value. The yellow box represents the healthy range for adult salmonids, which is a healthy salmonid range of 6.7 to 8.3 for adult Chinook salmon for October (Figure 2-8) (Bell 1986). The ranges for October are: max=6.99 and 7.90, min=6.29 and 6.32, median=6.70 and 6.93. The range for March are: max=6.6 and 6.67, min=6.27 and 6.40, median=6.33 and 6.54.
 -
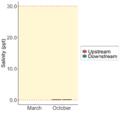 Figure 2-9. Salinity in ppt for both the upstream and downstream sampling locations in March 2022 and October 2022. Samples were not tested for salinity in March. There is a sample size of 12 for both the upstream and downstream locations in October. The top whiskers indicate the maximum value, while the bottom whiskers indicate the minimum value. The line through the middle of each box represents the median value. The yellow box represents the healthy range for juvenile and adult salmonids, which is between 0 mg/L and 30 mg/L(Foras na Mara Marine Institute 2017). The ranges for October are: max=.1 and .1, min=.1 and .1, median=.1 and .1.
 -
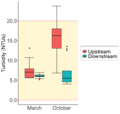 Figure 2-10. Turbidity in NTUs for both the upstream and downstream sampling locations in March 2022 and October 2022. There is a sample size of 12 for both the upstream and downstream locations in March and October. The top whiskers indicate the maximum value, while the bottom whiskers indicate the minimum value. The line through the middle of each box represents the median value. The yellow box represents the healthy range for adult and juvenile salmonids, which is between 0-20 NTU (Lloyd 1987). The ranges for October are: max=23.7 and 13.5, min=6.8 and 4.0, median= 16.3 and 5.5. The ranges for March are: max=13.10 and 6.88, min=5.56 and 5.16, median=7.02 and 6.05.
 -
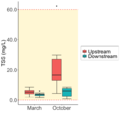 Figure 2-11. TSS in mg/L for both the upstream and downstream sampling locations in March 2022 and October 2022. There is a sample size of 10 for both the upstream and downstream locations in March and October. The top whiskers indicate the maximum value, while the bottom whiskers indicate the minimum value. The line through the middle of each box represents the median value. The yellow box represents the healthy range for adult salmonids, which is between 0-60 mg/L (Ye et al. 2015). The ranges for October are: max= 62.2 and 8.5, min= 4.3 and 0.8, median= 16.1 and 5.7. The ranges for March are: max=8.5 and 5.9, min=1.9 and 1.6, median=5.1 and 3.6.


Discussion
[edit | edit source]Dissolved Oxygen
[edit | edit source]The upstream range for DO in October is [0.70, 9.30] mg/L, with a median of 4.14 mg/L. The downstream range for October is [6.30, 10.9] mg/L with the median equal to 9.50 mg/L. The upstream range for DO in March is [2.2, 5.2] mg/L and median=3.6 mg/L. The downstream range in March is [7.0, 10.2] , with median = 8.5 mg/L. The dissolved oxygen level increases from upstream to downstream both in March and October, though the October DO readings have a wider range than the March DO readings (Figure 2-5). Meteorological data presented in Appendix C shows an average monthly temperature of 55.9°F in March and 59.7°F in October; this would seem to imply that the average DO would be higher in October, because DO varies inversely with temperature. However, the average minimum temperature is 48.1°F in March and 42.0 °F in October; this may explain the elevated DO readings in October, but a proper hypothesis test is required to make a definitive stataement.
The increase in DO after the confluence indicates that up until that point, the south fork contains more DO than the main stem. When the two streams meet at the confluence, the additional DO in the south fork enters the main stem, thus increasing the DO after the confluence. The upstream location has a lower flow rate, meaning not as much oxygen would be aerated in the water as there would be downstream. There is additionally an overgrowth of vegetation at the upstream location, which would decay. These combined could be contributing factors to the lower DO level upstream of the confluence. Most of the upstream values are below the healthy level for adult, embryonic, and larval stages of salmonids, which is between 6.5 mg/L and 9.75 mg/L (EPA 1986, Carter 2005). However, all downstream DO values are at least as high as the recommended healthy range for adult, embryonic, and larval salmonids.
Temperature
[edit | edit source]The upstream range in October was [10.8, 12.6] °C with median = 11.8°C, and the downstream range was [10.5, 12.6] °C with median = 11.6°C. The upstream range in March was [7.8, 10.8] °C with median = 9.7°C, and the downstream range was [6.7, 10.0] °C with median = 9.1°C. From the upstream to downstream locations, there was a decrease in temperature both in March and in October (Figure 2-6). The temperature dropped by less than 1.5°C. This indicates that the south fork temperature is likely lower than the main stem temperature, thus lowering the temperature after the confluence. Because cold water can hold more dissolved oxygen than warm water, we might expect to see a positive relationship between DO and temperature (USGS 2018). Because water temperatures are normally colder in the spring than in the fall, we might expect higher DO levels in March than in October. However, this was not necessarily the case, as the range of DO values in October spanned both lower and higher than the range of DO values in March. However, all temperature readings for both locations and seasons remain within the healthy range for juvenile and adult coho and steelhead salmon (4.5 - 14.5°C) (Bell 1986).
Specific Conductivity
[edit | edit source]The ranges for Specific Conductivity in March are: [31.4, 89.49] µS/cm with median = 77.3 µS/cm for the upstream location, and [51.0, 94.4] µS/cm with median = 82.2 µS/cm for the downstream. The readings for both sites in October are all equal to zero; these anomalous results are discussed further in this section. The specific conductivity was overall consistent for both locations in March of 2022, with an increase from the upstream to the downstream location (Figure 2-7). This slight increase could indicate higher conductivity in the south fork, thus increasing the conductivity after the confluence. However, all specific conductivity values were read as 0 µS/cm in October. There is no known reason why this would occur, so an in-field equipment error is a likely explanation, and the 0 µS/cm may be invalid. All conductivity values for both March and October are below the healthy range for adult salmonids, which is between 150 mg/L and 500 mg/L (EPA 2012).
pH
[edit | edit source]The upstream range for pH in October is [6.29, 6.99], with median = 6.70; the downstream range is [6.93, 7.90] with median = 6.93. The upstream range for March is [6.27, 6.60], with median = 6.70; the downstream range is [6.40, 6.67] with median = 6.54. In both March and October, pH levels increased from the upstream location to the downstream location. This indicates that the south fork is more basic than the mainstem, decreasing the acidity after the confluence. This could perhaps be explained by different soil types between the main stem and forested south fork, or more acidic runoff entering the mainstem than the south fork. The pH was below the healthy range for salmonids for both locations in March, while some values were within and some were below the healthy salmonid range of 6.7 to 8.3 for adult Chinook salmon for October (Figure 2-8) (Bell 1986). This is of concern, as low pH levels have been shown to harm the health and reproduction abilities of juvenile and adult salmonids (Rumbough, 1983).
Salinity
[edit | edit source]Salinity was not recorded in the March sampling period. In the October sampling period, all salinity values were 0.1 mg/L (Figure 2-9). While adult salmon are often able to survive in waters with high salinity, early life-stages of salmonids are unable to tolerate salinity and require freshwater to develop in (Baggerman 1960). The 0.1 mg/L of salinity recorded in October is within the healthy range for juvenile and adult salmonids of between 0 mg/L and 30 mg/L (Foras na Mara Marine Institute 2017).
Turbidity
[edit | edit source]The downstream range for turbidity in October is [6.8, 23.7] NTU with median = 16.3 NTU, and the downstream range for October is [4.0, 13.5] NTU with median = 5.5 NTU. The turbidity decreased from the upstream location to the downstream location in both March and October (Figure 2-10). Additionally, the range of turbidity values were higher in March than in October. The overall decrease in turbidity indicates that the south fork is less turbid than the main stem, so the mainstem turbidity decreases following the confluence. In March, all values were within the healthy range for adult and juvenile salmonids (0-20 NTU) (Lloyd 1987). In October, some values in the upstream location were above the healthy range for adult salmonids, while most were within the healthy range. All downstream samples were within the healthy range for adult salmonids in October. Increased turbidity levels can lead to harmful health effects for adult and juvenile salmonids, so it is important to understand how the south fork is affecting the turbidity of Janes Creek.
Total Suspended Solids
[edit | edit source]The upstream range for TSS in October was [4.3, 62.2] mg/L with median = 16.1 mg/L, and the downstream range was [0.8, 8.5] with median = 5.7 mg/L. The upstream range for TSS in March was [1.9, 8.5] mg/L with median = 5.1 mg/L, and the downstream range was [1.6, 5.9] with median = 3.6 mg/L. The level of total suspended solids decreases from the upstream location to the downstream location in both March and October (Figure 2-11). Additionally, the range of TSS values is wider in March than in October in both locations (Figure 2-11). This indicates that the main stem before the confluence has more total suspended solids than does the south fork before the confluence. When the south fork connects to the main stem at the confluence, it decreases the total suspended solids downstream of the confluence. All values at both locations and time periods are within the healthy range for adult salmonids of between 0-60 mg/L (Ye et al. 2015).
Conclusion
[edit | edit source]The objective of this project was to determine the impact of the forested Janes Creek south fork on the water quality of the Janes Creek main stem after the confluence, with relation to total suspended solids, dissolved oxygen, temperature, specific conductivity, pH, salinity, and turbidity. Due to the differing land cover types between the main stem before the confluence and the south fork, we predicted that confluence may have an impact on some water quality parameters, thus affecting the habitat suitability for salmonids. For several of the parameters (DO, temperature, pH, turbidity, TSS), the water quality and habitat suitability for adult salmonids did remain within the healthy range or improve after the confluence. The specific conductivity and salinity did not have any conclusive changes from the upstream to downstream locations, or from the March sampling period to the October sampling period.
References
[edit | edit source]- Baggerman, B. (1960). “Salinity preference, thyroid activity and the seaward migration of four species of Pacific salmon (oncorhynchus).” Journal of the Fisheries Research Board of Canada, 17(3), 295–322.
- Bell, M.C. (1986). “Fisheries handbook of engineering requirements and biological criteria.” Fish Passage Development and Evaluation Program. U.S. Army Corps of Engineers.
- Carter, K. (2005). The effects of dissolved oxygen on steelhead trout, Coho Salmon, and Chinook Salmon biology and function by life stage. California Regional Water Quality Control Board, North Coast Region, 10.
- EPA (1986). Quality Criteria for Water. Washington DC: Office of Water Regulations and Standards.
- EPA (2012). “5.9 conductivity.” EPA, Environmental Protection Agency, https://archive.epa.gov/water/archive/web/html/vms59.html (Apr. 20, 2022).
- Foras na Mara Marine Institute (2017). “The Farmed Salmonid Handbook.” Fish Health Unit, Foras na Mara Marine Institute, https://www.fishhealth.ie/fhu/health-surveillance/aquaplan-fish-health-management-ireland/farmed-salmonid-handbook
- Hümann, M., Schüler, G., Müller, C., Schneider, R., Johst, M., and Caspari, T. (2011). “Identification of runoff processes – the impact of different forest types and soil properties on runoff formation and floods.” Journal of Hydrology, 409(3-4), 637–649.
- Llyod, D. S. (1987). “Turbidity as a Water Quality Standard for Salmonid Habitats in Alaska.” North American Journal of Fisheries Management, 7(2).
- Rombough, P. J. (1983). “Effects of low ph on eyed embryos and Alevins of Pacific Salmon.” Canadian Journal of Fisheries and Aquatic Sciences, 40(10), 1575–1582.
- USGS (2016). “Dissolved oxygen and water completed.” Dissolved Oxygen and Water | U.S. Geological Survey, Water Science School, https://www.usgs.gov/special-topics/water-science-school/science/dissolved-oxygen-and-water
- Ye, S., & Ying, Q. (2015). Water quality in RAS for salmonids and performance of MBBR: case study at Vik Settefisk AS (Master's thesis, Norwegian University of Life Sciences, Ås).
Raw data
[edit | edit source]
| Authors | Margarita Otero-Diaz, Zane Cook, Kayla Fitzpatrick, Benjamin Hung |
|---|---|
| License | CC-BY-SA-4.0 |
| Organizations | Cal Poly Humboldt |
| Cite as | Margarita Otero-Diaz, Zane Cook, Kayla Fitzpatrick, Benjamin Hung (2023–2026). "Influence of Janes Creek South Fork Confluence on Main Stem". Appropedia. Retrieved July 12, 2026. |