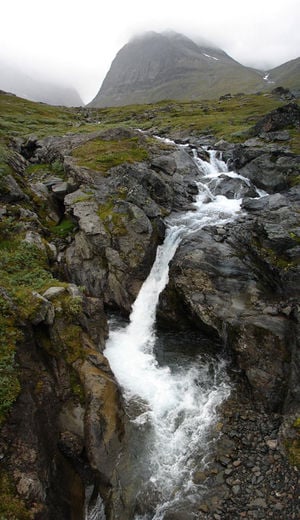
Figure 1. A flowing mountain stream.
Flow is the total volume of a fluid that flows past a fixed point in a river or stream over time. It is comparable to the speed at which a volume of fluid travels as seen in Figure 1. Volumetric flow rates can be measured in various volume/time units such as:
- Liters per second (L/s)
- Cubic feet per second (ft³/s)
- Gallons per minute (gal/min)
- Cubic meters per second (m³/s)
Household tools or specialized meters can be used to find flow rates for pipes, sewage systems, and household appliances. People use flow data for microhydro systems, wastewater systems, rainwater catchment, water auditing, settling rates, water table statistics, and other water related information. To find the flow of larger water bodies such major rivers or behind dams, meters are used.[1]
This page describes low-tech methods to determine flow of small streams and rivers, as well as other tools that can be used for this purpose.
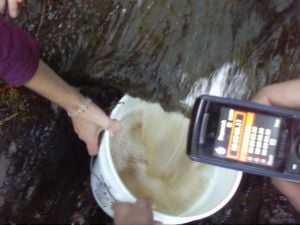
Figure 2. Finding the flow rate using a bucket.
The Bucket method is a simple way to measure the flow rate using household items. It requires a stopwatch, a large bucket, and preferably two to three people. To measure the flow rate using the bucket method:
- Measure the volume of the bucket or container. Keep in mind that a typical 5 gallon bucket is often actually less than 5 gallons.
- Find a location along the stream that has a waterfall. If none can be found, a waterfall can be constructed using a weir (see Figure 4).
- With a stopwatch, time how long it takes the waterfall to fill the bucket with water. Start the stopwatch simultaneously with the start of the bucket being filled and stop the stopwatch when the bucket fills. The bucket should not be filled by holding it below the surface of the stream because it is not the true flow rate.
- Record the time it takes to fill the bucket.
- Repeat steps two and three about six or seven times and take the average. It is a good idea to do a few trial runs before recording any data so that one can get a feel for the timing and measurements required.
- Only eliminate data if major problems arise such as debris from the stream interfering with the flow.
- The flow rate is the volume of the bucket divided by the average time it took to fill the bucket.[2]
Bucket method data for flow (example)
Trial Number
|
Time (seconds)
|
Bucket Volume (gallons)
|
1
|
13.2
|
5
|
2
|
14
|
5
|
3
|
14.5
|
5
|
4
|
13
|
5
|
5
|
13.4
|
5
|
6
|
13.1
|
5
|
Here is an example using data found for the flow rate of the Jolly Giant Creek on Cal Poly Humboldt grounds: Using this data, the volumetric flow rate (Q) is equal to the volume of the bucket (V) divided by the average time (t).

where
so
and
So the flow rate is 0.37 gallons/second or Q = 0.37 gal/sec * 60 sec/min = 22.2 gallons/minute.
Therefore the flowrate (Q) is 22.2 GPM.
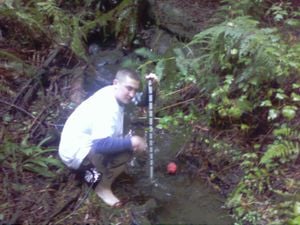
Figure 3. Finding the flow rate using a float and a meter stick.
The float method (also known as the cross-sectional method) is used to measure the flow rate for larger streams and rivers. It is found by multiplying a cross sectional area of the stream by the velocity of the water. To measure the flow rate using the float method:
- Locate a spot in the stream that will act as the cross section of the stream.
- Using a meter stick, or some other means of measurement, measure the depth of the stream at equal intervals along the width of the stream (see Figure 3). This method is similar to hand calculating a Riemann sum for the width of the river.
- Once this data is gathered, multiply each depth by the interval it was taken in and add all the amounts together. This calculation is the area of a cross section of the stream.
- Decide on a length of the stream, typically longer than the width of the river, to send a floating object down (oranges work great).[3]
- Using a stopwatch, measure the time it takes the float to travel down the length of stream from step 4.
- Repeat step five 5-10 times and determine the average time taken for the float to travel the stream. Throw the float into the water at different distances from the shoreline in order to gain a more accurate average.
- Divide the stream length found in step 4 by the average time in step 6 to determine the average velocity of the stream.
- The velocity found in step 7 must be multiplied by a friction correction factor. Since the top of a stream flows faster than the bottom due to friction against the stream bed, the friction correction factor evens out the flow. For rough or rocky bottoms, multiply the velocity by 0.85. For smooth, muddy, sandy, or smooth bedrock conditions, multiply the velocity by a correction factor of 0.9.
- The corrected velocity multiplied by the cross sectional area yields the flow rate in volume/time. (Be sure to keep consistent units of length/distance when measuring the cross section and the velocity e.g. meters, feet)
Weirs are small dams that can be used in measuring flow rate for small to medium sized streams (a few meters or wider). They allow overflow of the stream to pour over the top of the weir, creating a waterfall, as seen in Figure 4. Weirs increase the change in elevation making the streamflow more consistent which makes flow rate measurements more precise. However, it is very important that all the water in the stream be directed into the weir for it to accurately represent the stream flow. It is also important to keep sediment from building up behind the weir. Sharp crested weirs work best. There are many different types of weirs which include broad crested weirs, sharp crested weirs, combination weirs, V-notch weirs and minimum energy loss weirs.
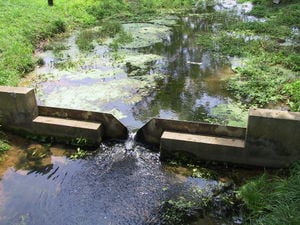
Figure 4: An example of a V-notch weir.
Meters are devices that measure the stream flow by directly measuring the current. There are many different types of meters but the most common are the Pygmy meter, the vortex meter, the flow probe, and the current meter, described below:
Pygmy meter: a wheel is rotated by water flow and the rate of the rotation signifies the water velocity. It is primarily used in measuring discharge.[4]
Vortex meter: velocity is proportional to the downstream frequency of the vortex flow and is read on a digital readout. It is used for measuring flow in pipes.[5]
Flow probe: the flow turns a propeller that sends the water velocity data to a digital readout display in ft/s or m/s[6]
Current meter: electronic pulses determine water velocity. Can be used in large bodies of water like oceans to measure the current.[7]
To Catch the Rain is the first book created from this much exclusive Appropedia content on rainwater. Thank you for making it happen! Get it digitally
here or as paperback on
Amazon.
- ↑ Engineers Edge. (2000). Fluid Volumetric Flow Rate - Fluid Flow. Retrieved October 28, 2009, from Engineer's Edge website: http://www.engineersedge.com
- ↑ Trimmer, W.L. (1994 September). Estimating Water Flow. Retrieved October 29, 2009, from Oregon State University website: http://web.archive.org/web/20091122100921/http://extension.oregonstate.edu:80/catalog/pdf/ec/ec1369.pdf
- ↑ Wikipedia. (2009, October). Streamflow. Retrieved October 28, 2009, from Wikipedia website: http://en.wikipedia.org/wiki/Streamflow
- ↑ Geo-Scientific Ltd. (2001). Flow and Current Meters. Retrieved November 7, 2009, from Geo-Scientific Ltd. website: http://www.geoscientific.com/flowcurrent/index.html
- ↑ Cahner Publishing Company. (1984, November 21). Liquid Flowmeters. Retrieved October 28, 2009, from Omega Engineering website: http://web.archive.org/web/20170909023441/http://www.omega.com:80/techref/flowcontrol.html
- ↑ Geo Scientific Ltd. (2001). Global Flow Probe. Retrieved November 7, 2009, from Geo Scientific Ltd. website: http://www.geoscientific.com/flowcurrent/Flow_Probe.html
- ↑ Geo Scientific Ltd. (2001). Swoffer Current Meter. Retrieved November 4, 2009, from Geo Scientific Ltd. website: http://www.geoscientific.com/flowcurrent/Swoffer2100_CurrentMeter.html
Page dataPart of |
Engr115 Intro to Engineering, Engr305 Appropriate Technology |
---|
Keywords |
measurement, flow rate, water, how tos, water, microhydro |
---|
SDG |
SDG06 Clean water and sanitation |
---|
Authors |
Lonny Grafman, Monica Napoles, Andrew Collins-Anderson, Nathan Hawk |
---|
License |
CC-BY-SA-3.0 |
---|
Affiliations |
Cal Poly Humboldt |
---|
Language |
English (en) |
---|
What links here |
26 pages |
---|
Aliases |
How to Measure Flow, How to measure water flow, How to measure flow rate |
---|
Translations |
Spanish, German, Italian, French, Portuguese, Hebrew, Korean, Hindi, Chinese, Croatian |
---|
Impact |
155,192 |
---|
Created |
October 26, 2009 by Lonny Grafman |
---|
Modified |
June 9, 2023 by Felipe Schenone |
---|
Cite as |
Lonny Grafman, Monica Napoles, Andrew Collins-Anderson, Nathan Hawk (2009–2023). "How to measure stream flow rate". Appropedia. Retrieved September 23, 2023. |
---|
API queries |
basic, semantic, html, files, more |
---|
Contact email: adc37@humboldt.ed
Names of writers: Monica Napoles and Nathan Hawk
- Who do you feel is the target audience for the writing in this document? Suggest a change if you think the writing is not appropriate for this audience.
- I feel that the target audience would be someone looking at creating a micro-hydro system or some other small stream related technology. I feel that the writing could explain a little bit more behind each process, but it also could be a bit more technical.
- Is the information presented easy to navigate? Can you find the necessary information easily? How would you improve the layout?
- I feel that the information is easy to navigate, but the format is dry. Maybe some more subheadings should be made, but it isn't very hard to find the information.
- Are headings used successfully? Are enough headings used? If so, are they specific enough? Are the headings in logical order? If not, would the document be easier to follow with more headings? Level two headings? If so, suggest some headings.
- See above. I feel that the headings a relatively well done, but there needs to be more information which would include more headings and more organization. Not bad.
- Is there a clear topic sentence for each paragraph? Do all following sentences relate to that topic sentence? How could topic sentences of the paragraphs be improved? Suggest improvements for specific paragraphs.
- There is not a clear topic sentence for each category. I feel like the page starts off very strong, but as we move through it the information is lacking and abbreviated.
- There should be more information on meters. There is also not enough information on what flow rate is. If there is another page dedicated to this a link should be added.
- Is the writing objective? Remember this is a technical communication. Make suggestions to avoid bias or opinion in sentences. (For example: eliminate adjectives/adverbs: very, many, large, etc)
- The writing is very objective. Good job here.
- Is each figure or photograph easy to understand? How could the figures be improved? Can you suggest another figure presents the information in a clearer manner?
- The images are very good. Maybe you could put a picture of a stream or river that is moving very fast. You need to reference where you got your images.
- Does the writer refer to the figure(s) in the text using figure numbers? Is each figure well described in the text and are the sources cited? Do the figures have captions? Make suggestions to better incorporate figures.
- You do not have any figures. You may include an example of some stream flow measurements or a figure on the actual process done for stream measurements. I am not too sure how to help you here.
- If this is a RCEA page have the writers clearly presented the bottom line (predicted money and carbon dioxide emissions saved versus actual money and carbon dioxide emissions saved) in a table or graphical format? Suggest improvements to make this comparison easier for the reader to understand.
- This is not a RCEA project.
- Are there any questions you have about the topic that are not addressed? Are the sources of the information clearly presented under "References"?
- You need more references. You have some, but a lot of your information is not documented. Good job on reference formatting. I feel like you could go into more detail on this topic, I am not sure where though. Maybe you could have a section on what stream flow measurements are used for.
- Does the author provide links to related sites? Are there enough or too many? Are they technical enough or too technical for the audience of the document? Is the relevance of each site clear? Is there a summary of references?
- You should finish the related readings page because it is a good idea. Some more related sites would be good as well. Maybe a page for micro-hydro or something.
- Is the document too long or short? (It should be between 2-3 pages). If it is too long, what should be taken out? If it is too short what remains to be addressed?
- It is pretty close to a good length. Maybe some more diverse information, and shorten the discussions on bucket and float methods.
- Does the page have the "ENGR 115: In Progress" banner? Does the page have the correct categories (ENGR 115 and RCEA if applicable) at the end of page?
- Yes!
- List the strengths of document - (Be sure to address how the Appropedia page looks at this time.)
- This is a very good first draft. You have given a broad overview of how to measure flow rate. The appearance of the site is appealing and it is well organized. The information provided is well written and easy to understand.
- List areas for improvement – (Be sure to address how the Appropedia page looks at this time.)
- I feel that you should go into more detail on what flow rate is. You need more references and you could improve the formatting a little bit. You should cite the sources of your images. As I stated earlier more diverse information may round out your page, but that is a matter of opinion.
- Overall comments – (Any feedback for the authors)
- This is a good page and you are on the right track. My main concerns are that you reference all information and finish up the further readings section.
User:Adc37
Contact Information: ccs31@humboldt.edu
Names of Writers: Monica Napoles and Nathan Hawk
- Who do you feel is the target audience for the writing in this document? Suggest a change if you think the writing is not appropriate for this audience.
- A layman curious about how to measure flow.
- Is the information presented easy to navigate? Can you find the necessary information easily? How would you improve the layout?
- Yes it is easy to follow the headings. The only issue I had with the layout was I thought it was odd that only the Float Method was written in a numerical step by step instruction. I think changing either this one or the others would beneficial for your formats more continuity.
- Are headings used successfully? Are enough headings used? If so, are they specific enough? Are the headings in logical order? If not, would the document be easier to follow with more headings? Level two headings? If so, suggest some headings.
- The headings are easy to follow, the only one I find odd is the double heading of "Further Reading" with "References" right below it. Maybe combine them into one if you want to keep both. Ex: "Further Reading and References" or "References / Further Reading"…
- Is there a clear topic sentence for each paragraph? Do all following sentences relate to that topic sentence? How could topic sentences of the paragraphs be improved? Suggest improvements for specific paragraphs.
- Your opening sentence seems to read a little awkward. It is clear but has a hint of a run on sentence feel to it. I think with some extra thought you could make it read a little more clearly and concisely. (Probably not a big deal though)
- Is the writing objective? Remember this is a technical communication. Make suggestions to avoid bias or opinion in sentences. (For example: eliminate adjectives/adverbs: very, many, large, etc)
- I think the bucket method part is a little awkward where you suggest a number of people and bucket size when these would very greatly with the size of the flow being measured. Depending on the level of laymen we are expected to present to, you may want to take the time to find a way to present technically, the obvious impracticality of measuring greater volumes of water with this method of personally handling buckets.
- Is each figure or photograph easy to understand? How could the figures be improved? Can you suggest another figure presents the information in a clearer manner?
- I thought that the photos were easily understood
- Does the writer refer to the figure(s) in the text using figure numbers? Is each figure well described in the text and are the sources cited? Do the figures have captions? Make suggestions to better incorporate figures.
- The figures are not directly referenced or explained in the test but they did have captions and were easily followed and understood by me.
- If this is a RCEA page have the writers clearly presented the bottom line (predicted money and carbon dioxide emissions saved versus actual money and carbon dioxide emissions saved) in a table or graphical format? Suggest improvements to make this comparison easier for the reader to understand.
- Not RCEA
- Are there any questions you have about the topic that are not addressed? Are the sources of the information clearly presented under "References"?
- Just the double Reference title that was mentioned previously.
- Does the author provide links to related sites? Are there enough or too many? Are they technical enough or too technical for the audience of the document? Is the relevance of each site clear? Is there a summary of references?
- The links provided are easy to see and use
- Is the document too long or short? (It should be between 2-3 pages). If it is too long, what should be taken out? If it is too short what remains to be addressed?
- Length looks good
- Does the page have the "ENGR 115: In Progress" banner? Does the page have the correct categories (ENGR 115 and RCEA if applicable) at the end of page?
- Yes, looks good
- List the strengths of document - (Be sure to address how the Appropedia page looks at this time.)
- I think that at this point the look of this page is one of its major strengths. It has a good clear layout along with pictures to make it more aesthetically interesting.
- List areas for improvement – (Be sure to address how the Appropedia page looks at this time.)
- The intro is a little choppy as mentioned. I think it is a little odd to mention the speed of the flow without the necessary volume correlation.
- Overall comments – (Any feedback for the authors)
- Overall I thought it looked good. I think you should look at all my comments but because I am also still feeling out the requirements of this project I wouldn't follow my word blindly.
User:Ccs31
Name of Editor: Benjamin Stern
Contact Information: brs@humboldt.edu
Names of Writers: Monica Napoles and Nathan Hawk
- Who do you feel is the target audience for the writing in this document? Suggest a change if you think the writing is not appropriate for this audience.
- It appears that the target audience is primary educated students looking for an idea for their science project. The simple language and the step-by-step how to format is directed towards an audience of high school or below. I understand that to topic is specifically "how to measure flow", but you could improve your site by adding the importance of measuring flow and situations in which you would need to use that data. Also you should go into more depth about the meters, because those are obviously the methods more commonly used in the field.
- Is the information presented easy to navigate? Can you find the necessary information easily? How would you improve the layout?
- The layout is easy to read being in number/bullet form and the pictures are spaced appropriately You should add a large and attractive title and brief description of your webpage at the top. I like how it is organized from easiest/simplest method to most difficult.
- Are headings used successfully? Are enough headings used? If so, are they specific enough? Are the headings in logical order? If not, would the document be easier to follow with more headings? Level two headings? If so, suggest some headings.
- Headings are well used and spread out. I would suggest a larger title heading and to better distinguish the subheadings of the types of meters from the meter heading itself.
- Is there a clear topic sentence for each paragraph? Do all following sentences relate to that topic sentence? How could topic sentences of the paragraphs be improved? Suggest improvements for specific paragraphs.
- There are no paragraphs, but each bulleted section does directly relate to the topic sentence. Each sentence before the section clearly states what method is going to be explained.
- Is the writing objective? Remember this is a technical communication. Make suggestions to avoid bias or opinion in sentences. (For example: eliminate adjectives/adverbs: very, many, large, etc)
- The writing is objective; there are no opinions in the content of the webpage. Obviously the writing is paraphrased from your sources, but I didn't catch any hints of personal preference or see any unnecessary adverbs or adjectives, just the facts.
- Is each figure or photograph easy to understand? How could the figures be improved? Can you suggest another figure presents the information in a clearer manner?
- The pictures are well spaced and appropriate for each section, but the captions are too brief. The images would be more effective if the captions described the components of the photo and how it relates to the text, rather than the obvious item of the photo. For example, for your first image you could have the caption of, Figure 1: Bucket Method- flow rate being measured with a fixed volume of a bucket over time. This not only allows you to reference the photo (Figure 1) in your text, but also gives a very brief description of the whole section so readers can easily scan your page and get most of the information, because images attract the eyes of the reader more than words. Also I would suggest having an image (like a graph or chart) with meter readings to show how they work.
- Does the writer refer to the figure(s) in the text using figure numbers? Is each figure well described in the text and are the sources cited? Do the figures have captions? Make suggestions to better incorporate figures.
- As said above, figure numbers should be added to connect the text and images and the captions should be more detailed. The images fit the webpage well, you should add more to the meter section. Each image should have a reference link.
- If this is a RCEA page have the writers clearly presented the bottom line (predicted money and carbon dioxide emissions saved versus actual money and carbon dioxide emissions saved) in a table or graphical format? Suggest improvements to make this comparison easier for the reader to understand.
- This webpage is not connected with RCEA
- Are there any questions you have about the topic that are not addressed? Are the sources of the information clearly presented under "References"?
- Does flow rate only apply to rivers or streams? What about pipelines, sewage or and indoor appliances?
- Why does someone need to know about flow rate? How can the accuracy of flow rate measurements improve benefit waterways or improve efficiency of water-based technologies?
- What is the Reimman sum calculation and how do you use it?
- More detail on how each meter works and what conditions they work best.
- Does the author provide links to related sites? Are there enough or too many? Are they technical enough or too technical for the audience of the document? Is the relevance of each site clear? Is there a summary of references?
- There is an adequate collection of references at the bottom of the webpage. You should change the title of each reference from "source of information" to something specific about that reference. Example: Stream flow, for the first reference. There is a duplicated reference (4 and 5), which shouldn't be there. The references do fit well with the audience. Wikipedia and Geoscientific tend to gear towards the general curious public. I did notice that there are no links within the webpage. I would suggest an internal link for each method, so the reader could easily find more information on that topic.
- Is the document too long or short? (It should be between 2-3 pages). If it is too long, what should be taken out? If it is too short what remains to be addressed?
- I know this is a first draft, but the webpage is too short. Again there should be more information about the meter technologies and the significance of knowing how to measure flow.
- Does the page have the "ENGR 115: In Progress" banner? Does the page have the correct categories (ENGR 115 and RCEA if applicable) at the end of page?
- Yes, the correct banner and category is there.
- List the strengths of document - (Be sure to address how the Appropedia page looks at this time.)
- Easy to read bullet format, easy to understand
- List areas for improvement – (Be sure to address how the Appropedia page looks at this time.)
- More explanation on meters, relate importance of the information to the audience, better picture captions, more links.
- Overall comments – (Any feedback for the authors)
- Good first draft, I look forward to seeing your final draft. I hope my comments are helpful in improving your webpage.
User:Brs34
- Who do you feel is the target audience for the writing in this document? Suggest a change if you think the writing is not appropriate for this audience.
- It seems the audience is any who have a basic knowledge of science and experimental procedure.The references are clearly presented.
- Is the information presented easy to navigate? Can you find the necessary information easily? How would you improve the layout?
- The layout is great. Alternating sides with the pictures are aesthetically pleasing. However, the description of the "Bucket Method" would be better viewed as a list (same as the following section).
- Are headings used successfully? Are enough headings used? If so, are they specific enough? Are the headings in logical order? If not, would the document be easier to follow with more headings? Level two headings? If so, suggest some headings.
- The headings are logically chosen and arranged. The alphabetized pattern used should stay consistent to the end, if it was your intention to do so.
- Is there a clear topic sentence for each paragraph? Do all following sentences relate to that topic sentence? How could topic sentences of the paragraphs be improved? Suggest improvements for specific paragraphs.
- Great topic sentences.
- Is the writing objective? Remember this is a technical communication. Make suggestions to avoid bias or opinion in sentences. (For example: eliminate adjectives/adverbs: very, many, large, etc)
- Yes.
- Is each figure or photograph easy to understand? How could the figures be improved? Can you suggest another figure presents the information in a clearer manner?
- A different bucket example could be used to more clearly convey the method. Perhaps a still shot of someone mid-procedure?
- Does the writer refer to the figure(s) in the text using figure numbers? Is each figure well described in the text and are the sources cited? Do the figures have captions? Make suggestions to better incorporate figures.
- No, the figures are not numbered or referred to. However, it doesn't seem necessary to refer to them as each step is clearly described in the lists. Perhaps it would be beneficial to do so if different photos are used and a specific part of the process can be referred to there.
- If this is a RCEA page have the writers clearly presented the bottom line (predicted money and carbondioxide emissions saved versus actual money and carbon dioxide emissions saved) in a table or graphical format? Suggest improvements to make this comparison easier for the reader to understand.
- N/A
- Are there any questions you have about the topic that are not addressed? Are the sources of the information clearly presented under "References"?
- The references are clearly presented.
- Does the author provide links to related sites? Are there enough or too many? Are they technical enough or too technical for the audience of the document? Is the relevance of each site clear? Is there a summary of references?
- There aren't enough related links. You could include a link for each type of meter; that could be useful. Also, perhaps a meter-conversion tool in the first section of the page would be relevant (or near your comment about keeping track of units). *I have omitted comments on sections that you already have made remarks*
- Is the document too long or short? (It should be between 2-3 pages). If it is too long, what should be taken out? If it is too short what remains to be addressed?
- Good length.
- Does the page have the "ENGR 115: In Progress" banner? Does the page have the correct categories (ENGR 115 and RCEA if applicable) at the end of page?
- Yes.
- List the strengths of document - (Be sure to address how the Appropedia page looks at this time.)
- List areas for improvement – (Be sure to address how the Appropedia page looks at this time.)
- Try to eliminate that gap after section 2.3. You've already done a great job of it so far, so just keep it consistent. You could just adjust the spacing in the paragraph that could solve the problem.-I found a couple of spelling errors: preferably, and Riemann.-It might be a good idea to include a table or two illustrating some of the calculations that need to be made for each method. It would make it easier for the user to follow along in your method.-It may also be helpful to separate your comments in the procedure with an asterisk; the steps will read better.
- Overall comments – (Any feedback for the authors)
- Great job! The process is described well and after your adjustments should be crystal clear!
Comments in this section are posted through a form that appears while reading the content page. Please do not add comments manually, but feel free to answer them by clicking the [reply] buttons.
- 👎 Why cant you just use text instead of this jacked up math crap. Anonymous 03:32, 11 June 2022 (UTC)
- 👍 Anonymous 20:20, 13 June 2022 (UTC)
- 👍 Got more options than expected thank you. Anonymous 09:08, 22 July 2022 (UTC)
- 👍 Anonymous 11:13, 22 August 2022 (UTC)
- 👍 Anonymous 18:07, 1 September 2022 (UTC)
- 👍 Describes many ways of calculating rate of flow in a stream. I am exploring feasibility of a micro hydro installation and these descriptions are useful to me. Anonymous 13:40, 4 September 2022 (UTC)
Cookies help us deliver our services. By using our services, you agree to our use of cookies.