
File:Impacts of inflation on PV economics.jpg
Size of this preview: 800 × 462 pixels. Other resolution: 1,038 × 599 pixels.
Original file (1,038 × 599 pixels, file size: 88 KB, MIME type: image/jpeg)
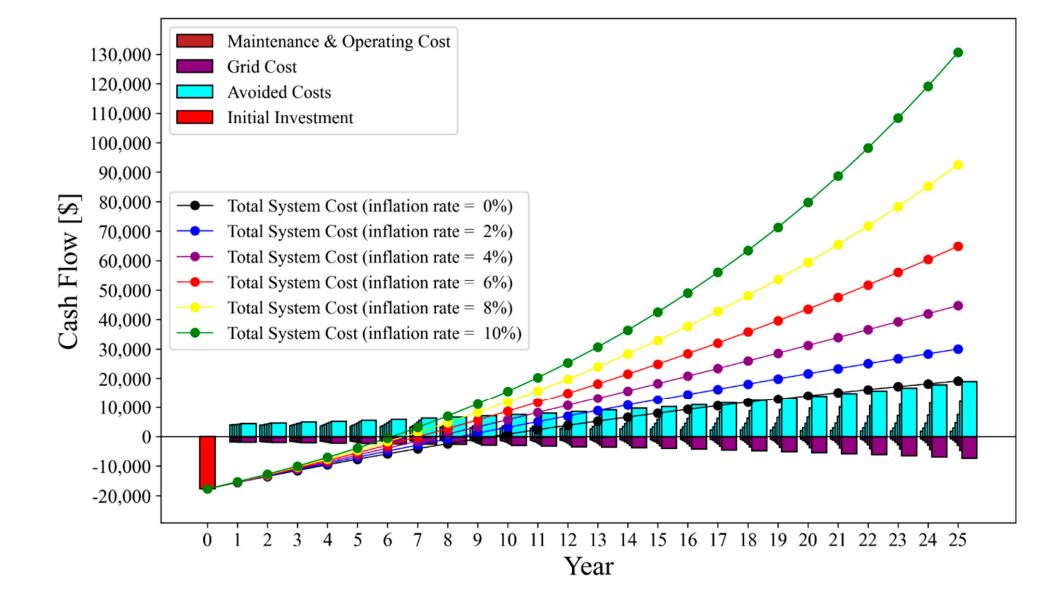
Cash flow chart of solar photovoltaic grid tied system for different inflation rates San Diego, CA. This demonstrates the potential for solar investments to act as inflation hedges. From the paper- Sadat, S. A., Mittal, K., & Pearce, J. M. (2025). Using Investments in Solar Photovoltaics as Inflation Hedges. Preprints. https://doi.org/10.20944/preprints202501.0347.v1
| Date created | January 6, 2025 |
|---|---|
| Author | Joshua M. Pearce |
| Date uploaded | January 6, 2025 |
| Uploader | Joshua M. Pearce |
| Source | Own work |
| License | Unknown |
File history
Click on a date/time to view the file as it appeared at that time.
| Date/Time | Thumbnail | Dimensions | User | Comment | |
|---|---|---|---|---|---|
| current | 23:37, 6 January 2025 | | 1,038 × 599 (88 KB) | J.M.Pearce (talk | contribs) | Uploaded own work with UploadWizard |
You cannot overwrite this file.
File usage
The following 10 pages use this file:
- A Free and open-source microgrid optimization tool: SAMA the Solar Alone Multi-Objective Advisor
- Case studies investigated with SAMA
- FAST
- Solar Alone Multi-objective Advisor (SAMA)
- Techno-Economic Evaluation of Electricity Pricing Structures on Photovoltaic and Photovoltaic-Battery Hybrid Systems in Canada
- The threat of economic grid defection in the U.S. with solar photovoltaic, battery and generator hybrid systems
- Using Investments in Solar Photovoltaics as Inflation Hedges
- User:J.M.Pearce
- Template:SAMA
- Category:FAST Completed