
Effects on Industries on the Portion of Jane's Creek Located Around ''The Ditch''

The ditch is a section of Jane’s Creek located along Aldergrove Road in Arcata CA. The area of study for Jane’s Creek located near the ditch was chosen because it is surrounded by industries which could potentially have negative impacts on the water quality.
Introduction
[edit | edit source]The sites are located along the Janes Creek watershed in Arcata, just south of the west end of Giuntoli Ln. (Figure 1-1). The upstream site for this project is named T4T and is labeled with a purple star in Figure 1-1. T4T is a designated water sampling site by the City of Arcata, and is located in a small wildlife refuge called Aldergove Marsh. Aldergrove Marsh is a heavily vegetated marsh, from which you can observe many insects flying around and many types of plants living there (Figure 1-3). It sits not too far away from a lumber mill, a gas station, and automobile repair shops labeled as in the industry in Figure 1-1 and labeled by name in Figure 1-2.
The car traffic and the lumber mill could be increasing the water’s turbidity by introducing trash or wood debris. The agricultural land located around the site could have fertilizer or animal waste runoff that could also decrease the water’s dissolved oxygen (DO); microbes consume oxygen in the water to degrade organic matter. The downstream site T4R is labeled with a pink star in Figure 1-1. T4R is a designated water sampling site by the city of Arcata. T4R is a narrower section of the creek than the upstream site that travels along the side of the road (Figure 1-4). Around it are industrial buildings, like a trucking company, a lumber mill, and a roofing contractor which are included in the general label of industry in Figure 1-1 and labeled by name in Figure 1-2.
There is also car traffic present next to the downstream site, and some foot traffic from people walking alongside the road. T4R is heavily vegetated with observed insects, and spiders, crawling around (Figure 1-4). The car and foot traffic could be affecting the water’s turbidity by introducing dirt and trash. In summary, the downstream water appears more affected by pollution than the upstream water from the fact that it is nearer industrial areas and car and foot traffic. The objective of this project is to measure the water quality of the Janes Creek watershed in two particular sites: upstream (T4T), and downstream (T4R) in order to determine potential negative impacts on salmonids.
Location of the ditch on Aldergrove Road in Arcata CA
[edit | edit source]-
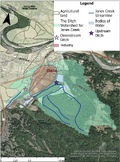 Figure 1-1: Jane’s Creek Ditch Watershed (ArcMap 2022, Humboldt County Web GIS 2022, Model My Watershed 2022, StreamStats 2022).
 -
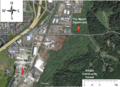 Figure 1-2: Site locations for upstream and downstream (Google Drawing, 2022).

Sampling Site Photos
[edit | edit source]-
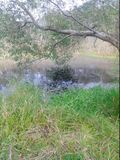 Figure 1-3: Photo of T4T (upstream)
 -
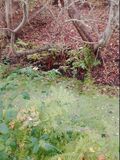 Figure 1-4: Photo of T4R (downstream)


Results
[edit | edit source]The data was collected at the upstream and downstream sites once a week over the course of the months of March and October in 2022; the March data was collected by the spring semester ENGR 351 students. The parameters measured were dissolved oxygen (DO), pH, salinity, temperature, turbidity, total suspended solids (TSS) and weather conditions at the sites. It should be noted that during week four it began to rain, which may have lowered the TSS for the upstream and downstream site (Table A-1 and A-2). The values for TSS for the downstream site week one tray ID “13” and week two tray ID “w” were significantly higher than the other samples collected in those weeks and we determined outliers by the box and whisker plots (Figure 1-11). This error may be due to experimental error such as misreading the volume input into the filter, and they were statistically considered an outlier and were not used for the calculation of average, standard deviation, median, and maximum (Table B-1).
Box and whisker plots were created based on a statistical analysis of each parameter: DO (Figure 1-5), temperature (Figure 1-6), conductivity (Figure 1-7), pH (Figure 1-8), salinity (Figure 1-9), turbidity (Figure 1-10), and TSS (Figure 1-11). Each plot represents the spatial and temporal trends of both the upstream and downstream sampling sites for March and October of 2022. The box and whisker plots also contain information on the healthy range of each parameter with respect to salmonids.
-
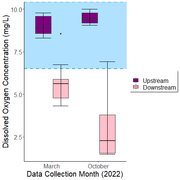 Figure 1-5: Box and whisker plot displaying upstream and downstream dissolved oxygen concentrations for March and October of 2022 in units of mg/L. The bottom and top of the box delineate the 25th and 75th percentiles, respectively, with the line across the box representing the median. The minimum and maximum are delineated by the bottom and top whiskers, respectively. Outliers are shown as individual data points. The healthy range of DO for adult salmonids, concentrations greater than 6.5 mg/L, is shown via the blue rectangle (EPA 1986).
 -
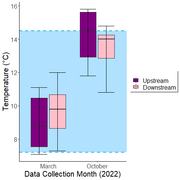 Figure 1-6: Box and whisker plot displaying upstream and downstream temperature for March and October of 2022 in units of ℃. The bottom and top of the box delineate the 25th and 75th percentiles, respectively, with the line across the box representing the median. The minimum and maximum are delineated by the bottom and top whiskers, respectively. Outliers are shown as individual data points. The healthy temperature range for adult Chinook salmon, 7.2 to 14.5℃, is shown via the blue rectangle (Bell 1986).
 -
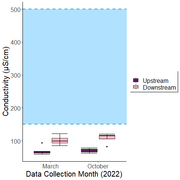 Figure 1-7: Box and whisker plot displaying upstream and downstream conductivity for March and October of 2022 in units of μS/cm. The bottom and top of the box delineate the 25th and 75th percentiles, respectively, with the line across the box representing the median. The minimum and maximum are delineated by the bottom and top whiskers, respectively. Outliers are shown as individual data points. The healthy conductivity range for mixed fisheries, 100 to 150 μS/cm, is shown via the blue rectangle (EPA 2012).
 -
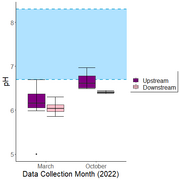 Figure 1-8: Box and whisker plot displaying upstream and downstream pH for March and October of 2022. The bottom and top of the box delineate the 25th and 75th percentiles, respectively, with the line across the box representing the median. The minimum and maximum are delineated by the bottom and top whiskers, respectively. Outliers are shown as individual data points. The healthy pH range for Chinook salmon, 6.7 to 8.3, is shown via the blue rectangle (Bell 1986).
 -
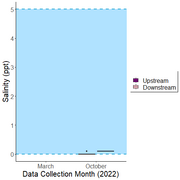 Figure 1-9: Box and whisker plot displaying upstream and downstream salinity for October of 2022 in units of ppt (parts per thousand). Salinity was not measured in March of 2022. The bottom and top of the box delineate the 25th and 75th percentiles, respectively, with the line across the box representing the median. The minimum and maximum are delineated by the bottom and top whiskers, respectively. Outliers are shown as individual data points. The healthy salinity range for juvenile Chinook salmon, less than 5 ppt, is shown via the blue rectangle (Long et al 1977).
 -
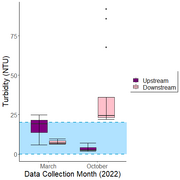 Figure 1-10: Box and whisker plot displaying upstream and downstream turbidity for March and October of 2022 in units of NTUs. The bottom and top of the box delineate the 25th and 75th percentiles, respectively, with the line across the box representing the median. The minimum and maximum are delineated by the bottom and top whiskers, respectively. Outliers are shown as individual data points. The healthy turbidity range for juvenile Coho salmon, less than 20 NTUs, is shown via the blue rectangle (Berg 1982).
 -
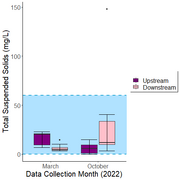 Figure 1-11: Box and whisker plot displaying upstream and downstream total suspended solids for March and October of 2022 in units of mg/L. The bottom and top of the box delineate the 25th and 75th percentiles, respectively, with the line across the box representing the median. The minimum and maximum are delineated by the bottom and top whiskers, respectively. Outliers are shown as individual data points. The healthy total suspended solids range for Atlantic salmon, less than 60 mg/L, is shown via the blue rectangle (Ye et al 2005).


Discussion
[edit | edit source]DO
[edit | edit source]During the sampling period of October 2022, the dissolved oxygen concentration of the upstream site was greater than that of the downstream location. The upstream site had a media DO concentration of 9.45 mg/L, while the downstream site had a median concentration of 2.27 mg/L (Table B-1). This spatial trend of decreasing DO between upstream and downstream is supported by the box and whisker plot (Figure 1-5). The upper whisker of the downstream site is below the lower whisker of the upstream site: the DO ranges do not overlap with each other. This decrease in DO was temporally consistent from March to October. However, we observed a much larger range of downstream value in October, as well as a lower median concentration (Figure 1-5). A possible explanation for this larger range in values is the storm that occurred before the final week of sampling. Following the storm, we observed a decrease in temperature for both sites from around 13.7℃ in week three to 10.9℃ in week four (Table B-1). The downstream site also experienced an increase in percent saturation of DO, from around 26% in week three to around 62% in week four (Table A-2). Combined with the increased flow rate from the storm, these factors could explain the increase in DO concentration we observed for the downstream site during week four and the subsequent increase in standard deviation. The difference in median concentrations between March and October could potentially be explained by weather. The median temperature was lower in March than in October (Figure 1-6). Since warm water holds less dissolved oxygen than cold water, this could explain why a higher downstream median DO in March was observed. For both March and October, only the upper end of the downstream whiskers were greater than 6.5 mg/L, the healthy range for adult salmonids (Figure 1-5). The exact cause of the decrease of DO is unknown. However, it could be speculated that the surrounding industries may be having an impact on the DO of the downstream site.
Temperature
[edit | edit source]During the sampling period of October 2022, there was little difference between temperature for the upstream and downstream sites. The box and whisker plot demonstrates that the temperatures for both locations were largely within the same range of values (Figure 1-6). There was also only a 0.5℃ difference in the median temperature of each site (Table B-1).
While the spatial difference was consistent between March and October, we observed an overall temperature difference. The median temperatures in October were around 14℃, while the median temperatures for March were closer to 10℃. This temporal difference is likely due primarily to seasonal changes in temperature. In general, temperatures in October were several degrees higher than in March (Tables C-1 and C-2).
For both October and March, the median temperatures of all sites were between 7.2℃ and 14.5℃, the healthy range for adult Chinook salmon (Figure 1-6). Based on the analysis, industry had a negligible effect, resulting in healthy temperatures for salmonids.
Conductivity
[edit | edit source]For the sampling done in October the downstream site had conductivity higher than that of the upstream site (Figure 1-7). The healthy range for conductivity for mixed fisheries is 100 to 150 μS/cm. Neither the upstream site nor the downstream site met the healthy range criteria for conductivity (Figure 1-7).
The sampling done in March showed the same spatial trend as in October (Figure 1-7). The upstream site had lower conductivity than the downstream site. Both sites were not within the healthy ranges for conductivity for mixed fisheries.
The conductivity of this section of Jane’s creek is consistently out of the healthy ranges to support salmonids. The conductivity ranges indicate that this section of Jane’s creek would not be suitable for mixed fisheries.
pH
[edit | edit source]During the sampling period of October 2022, it was found that the downstream site had a lower pH than the upstream site (Figure 1-8). The healthy range of pH for Chinook salmon is from 6.7 to 8.3. The upstream site inconsistently met the criteria for the healthy ranges, with the pH sometimes falling below 6.7 (Figure 1-8). The downstream site was consistently outside of the healthy range of pH for Chinook salmon.
The sampling done in March for pH follows a similar trend where the upstream site has a higher pH than the downstream site. However, the upstream site and downstream site both consistently fall below the healthy range of pH for Chinook salmon (Figure 1-8).
Both temporally and spatially this section of Jane’s creek did not meet the criteria for the healthy ranges of pH for Chinook salmon. For the sampling done in March and October the pH of the downstream site was lower than that of the upstream site. Potential impacts of industry runoff into the creek should be researched to see if this could be decreasing the pH of the creek.
Salinity
[edit | edit source]During October 2022, the salinity of the downstream site was higher than the salinity of the upstream site. The median upstream salinity was 0.0 ppt, while the median downstream salinity was 0.1 ppt (Table B-1). The salinity values for each sampling location were consistent across all four weeks, indicating that the higher downstream salinity could be a result of the surrounding industry (Table B-1). However, the lack of data from March of 2022 makes this conclusion difficult to support.
The salinity of both the upstream and downstream sampling sites were less than 5 ppt, the healthy salinity range for juvenile Chinook salmon (Figure 1-9). Based on the analysis, the potential impact of industry on salinity concentration was not significant enough to negatively affect salmonids.
Turbidity
[edit | edit source]During the sampling period of October 2022, the downstream site had higher turbidity than the upstream site (Figure 1-10). This difference was not temporally consistent between March and October of 2022. In March, the upstream site had higher turbidity than the downstream location. However, the temporal trend of turbidity was consistent with the temporal trend of TSS. During March, the TSS of the upstream site was higher than that of the downstream site, likely causing the higher measured turbidity (Figure 1-11). Likewise, in October, the higher downstream TSS could explain the higher downstream turbidity.
For March of 2022, the median turbidity of the upstream and downstream sites were less than 20 NTUs, the health range for juvenile Coho salmon (Figure 1-10). In October, the turbidity of the downstream location was within this healthy range, but the upstream turbidity was not. Assuming that the increase in TSS, and therefore the increase in turbidity, is a result of contamination by the surrounding industry, that industry is negatively impacting the health of salmonids.
TSS
[edit | edit source]During the sampling period of October 2022, the downstream site had a higher TSS concentration than the upstream site. The median TSS concentration for the downstream site was 11.8 mg/L, while the upstream site had a median of 5.6 mg/L (Table B-1). This difference in sampling sites was much more acute during the first two weeks of sampling, where the difference in average TSS concentration was closer to 50 mg/L. Weeks three and four saw a decrease in TSS, particularly for the downstream site. This could be due to the precipitation that occurred during those weeks, increased flow rate and washing away particulate matter (Table C-1). Our sampling technique also might have had an effect. As the weeks progressed, we did a much better job of not capturing excess sediment and debris, and only sampling the water.
If our assumptions about the second two weeks are true, then weeks one and two are more indicative of the potential effect of industry on TSS concentrations. The larger difference in concentrations during the first half of the October sampling period could be attributed at least in part to contamination and waste from the surrounding industrial sector.
The difference between sample sites was not temporally consistent between March and October of 2022. While the downstream site had higher TSS in October, it had less in March. One possible explanation for this difference is precipitation. During the October sampling period there were only three days with precipitation greater than 0.01 inches, while March had six.
For both October and March, all sites had TSS concentrations between 0 and 60 mg/L, the healthy range for Atlantic salmon (Figure 1-11). Based on the analysis, the potential impact of industry on TSS concentration was not significant enough to negatively affect salmonids.
Conclusion
[edit | edit source]The water quality parameters of dissolved oxygen (DO), pH, salinity, temperature, turbidity, and total suspended solids (TSS) were analyzed temporarily and spatially. The spatial trend observed with the most potential impact on salmonids is that the downstream site had lower DO than the upstream site (Figure 1-5). The spatial trend of the downstream site having lower DO and the upstream was witnessed for the data collection in March and October, with both downstream sites being below the healthy range for salmonids (Figure 1-5).
The turbidity for the downstream site was measured to be within the healthy ranges for March but not October (Figure 1-10). The upstream site was observed to be within the healthy ranges for both March and October. (Figure 1-10). Further measuring will have to be done in order to determine if the turbidity could be from impact from the surrounding industries.
Overall the water quality of the downstream site is similar to that of the upstream site except for the DO. The DO is crucial for salmonid health. The surrounding industries between the upstream and downstream site may be having a negative impact on the DO, thus making the quality of the water unsuitable for salmonids.
References
[edit | edit source]- Government of Northwest Territories. 2022. “Environment and Natural Resources” Accessed November 17, 2022. https://www.enr.gov.nt.ca/en
- National Oceanic and Atmospheric Administration. 2022. “Climate” National Weather Services. Accessed November 30, 2022. https://www.weather.gov/wrh/Climate?wfo=eka
- Bell, M.C. (1986). “Fisheries handbook of engineering requirements and biological criteria.” Fish Passage Development and Evaluation Program. U.S. Army Corps of Engineers.
- Berg, L. (1982). “Effects of Short Term Exposure to Suspended Sediment on the Behaviour of Juvenile” Pages 177-196 in G. F. Hartman et al., editors. Proceedings of the Carnation Creek workshop: a ten-year review. Department of Fisheries and Oceans, Pacific Biological Station, Nanaimo, Canada.
- EPA (1986). Quality Criteria for Water. Washington DC: Office of Water Regulations and Standards.
- EPA (2012). “5.9 conductivity.” EPA, Environmental Protection Agency, https://archive.epa.gov/water/archive/web/html/vms59.html (Apr. 20, 2022).
- Long, C. W., McComas, J. R., and Monk, B. H. (1977). “Use of Salt (NaCI) Water to Reduce Mortality of Chinook Salmon Smolts, Oncorhynchus tshawytscha, During Handling and Hauling.” Marine Fisheries Review, (1255).
- Ye, S., & Ying, Q. (2015). Water quality in RAS for salmonids and performance of MBBR: case study at Vik Settefisk AS (Master's thesis, Norwegian University of Life Sciences, Ås).
Appendix A. Raw Data
[edit | edit source]Table A-1 represents the data collected for the upstream site(T4T) for 4 weeks; 10/12/2022 - 11/02/2022.


Table A-2 represents the data collected for the downstream site(T4R) for 4 weeks; 10/12/2022 - 11/02/2022.


Appendix B. Intermediate Results
[edit | edit source]Table B-1 represents the average, sample size, standard deviation, and standard error for all the downstream and upstream site parameters.
-
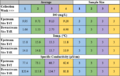 Table B-1: Upstream (T4T) and Downstream (T4R) sites intermediate data. Each color represents a week when the samples were collected and measured. The variables are average and sample size for the parameters DO, temperature, specific conductivity, pH, salinity, turbidity, and TSS.
 -
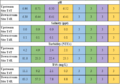 Table B-1: Upstream (T4T) and Downstream (T4R) sites intermediate data. Each color represents a week when the samples were collected and measured. The variables are average and sample size for the parameters DO, temperature, specific conductivity, pH, salinity, turbidity, and TSS.


-
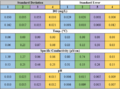 Table B-1 continued. The variables are standard deviation and standard error for the parameters DO, temperature, specific conductivity, pH, salinity, turbidity, and TSS.
 -
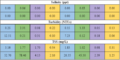 Table B-1 continued. The variables are standard deviation and standard error for the parameters DO, temperature, specific conductivity, pH, salinity, turbidity, and TSS.


Table B-2 represents the median, max, min, and sample size for all the downstream and upstream site parameters. Each section is divided for each parameter. Upstream on top, Downstream on bottom for each divided section.
Table B-2: Upstream/T4T and Downstream/T4R intermediate data. Data represents values for the entire collected month. Each section is divided for each parameter. Upstream on top, Downstream on bottom for each divided section. The variables are Median, Max, Min, Sample Size for the parameters DO, Temperature, Specific Conductivity, pH, Salinity, Turbidity, and TSS.
| Median | Max. | Min. | Sample Size | |
|---|---|---|---|---|
| DO (mg/L) | ||||
| Upstream Site T4T | 9.45 | 10.00 | 9.07 | 12 |
| Downstream Site T4R | 2.27 | 6.92 | 1.49 | 12 |
| Temp. (°C) | ||||
| Upstream Size T4T | 14.5 | 15.8 | 11.8 | 12 |
| Downstream Site T4R | 14.0 | 14.8 | 10.8 | 12 |
| Specific Conductivity (µS/cm) | ||||
| Upstream Size T4T | 69.6 | 79.0 | 62.5 | 12 |
| Downstream Site T4R | 115.8 | 121.0 | 114.2 | 9 |
| pH | ||||
| Upstream Size T4T | 6.61 | 6.97 | 6.49 | 12 |
| Downstream Site T4R | 6.41 | 6.45 | 6.38 | 12 |
| Salinity (ppt) | ||||
| Upstream Size T4T | 0.0 | 0.0 | 0.0 | 11 |
| Downstream Site T4R | 0.1 | 0.1 | 0.1 | 12 |
| Turbidity (NTUs) | ||||
| Upstream Size T4T | 2.5 | 7.1 | 1.9 | 12 |
| Downstream Site T4R | 23.5 | 25.5 | 22.1 | 9 |
| TSS (mg/L) | ||||
| Upstream Size T4T | 5.6 | 14.7 | 0.0 | 12 |
| Downstream Site T4R | 11.5 | 142.1 | 3.2 | 12 |
Appendix C. Previous data collection
[edit | edit source]Table C-1 represents the precipitation data for the collection month; 10/11/2022 - 11/02/2022.
-
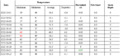 Table C-1: NOAA data collection from October 12th to November 2nd, 2022. Parameters include the date, temperature, precipitation, new snow, and snow depth. The red value represents the highest temperature throughout the month, the blue value represents the lowest temperature throughout the month, and the green value represents the highest precipitation throughout the month. (modified from NOAA 2022)
 -
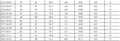 Table C-1: NOAA data collection from October 12th to November 2nd, 2022. Parameters include the date, temperature, precipitation, new snow, and snow depth. The red value represents the highest temperature throughout the month, the blue value represents the lowest temperature throughout the month, and the green value represents the highest precipitation throughout the month. (modified from NOAA 2022)

Table C-2 represents the precipitation data for the collection month; 03/09/2022 - 04/06/2022.
-
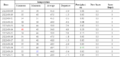 Table C-2: NOAA data collection from March 9th to April 6th, 2022. Parameters include the date, temperature, precipitation, new snow, and snow depth. The red value represents the highest temperature throughout the month, the blue value represents the lowest temperature throughout the month, and the green value represents the highest precipitation throughout the month. (modified from NOAA 2022).
 -
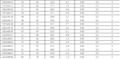 Table C-2: NOAA data collection from March 9th to April 6th, 2022. Parameters include the date, temperature, precipitation, new snow, and snow depth. The red value represents the highest temperature throughout the month, the blue value represents the lowest temperature throughout the month, and the green value represents the highest precipitation throughout the month. (modified from NOAA 2022).


Appendix D. Sample calculations
[edit | edit source]Sample equations and calculations for the total suspended solids (Eq.1-1), standard deviation (Eq.1-2), and standard error (Eq.1-3). The sample calculations are all for sample replicate #1 of week 1; 10/12/2022. Refer to table A-1 for specific values used in the calculations.
| Authors | Margarita Otero-Diaz, Alice De Lescure, Amanda Ratcliff, Justin Romani |
|---|---|
| License | CC-BY-SA-4.0 |
| Organizations | Humboldt Cal Poly |
| Cite as | Margarita Otero-Diaz, Alice De Lescure, Amanda Ratcliff, Justin Romani (2023–2024). "Effects on Industries on the Portion of Jane's Creek Located Around ''The Ditch''". Appropedia. Retrieved July 15, 2026. |