
The portion of Janes Creek assessed within this project is centered around Meadows Park, located on Janes Creek Dr. in Arcata, CA. Figure 3-1 shows the location of both the upstream site, indicated by the red star, and the downstream site, indicated by the green star, which were chosen specifically so that water quality can be assessed with and without the potential influences of Meadows Park and the surrounding residential area. The upstream sampling site, located at (40.88876 N , 124.08242 W), is next to the houses near the roundabout and just before the park. The upstream site is located about 20 feet from Janes Creek Dr. Figure 3-2 and 3-3 show the location of the upstream site. The downstream sampling location is shown in Figure 3-5 and is located at (40.88809 N , 124.08417 W). The downstream site is located under a bridge that crosses Janes Creek, shown in Figure 3-4, where there is what appears to be an old homeless camp located under the bridge, and some litter can be seen both next to the creek and in the creek. Both sampling sites are located near a populated neighborhood, and both are in close proximity to Meadows Park. The likely sources of contaminants in Janes Creek are oil runoff from roads, litter from walkers on the paths/park, litter from drivers, agricultural land, vegetation falling from overhanging trees and brush surrounding the creek, sprinkler runoff from houses, and pet waste. The objective of our project is to assess the impact of Meadows Park and the surrounding residential area on the water quality of Janes Creek and its suitability as habitat for salmonid species by comparing water quality parameters measured upstream and downstream of the influences.
Janes Creek Meadows Park Watershed[edit | edit source]

Sampling Site Photos[edit | edit source]
-
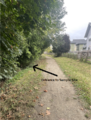
Figure 3-2: Photo of Upstream Janes Creek (trail).
-
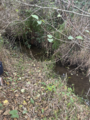
Figure 3-3: Photo of Upstream Janes Creek.
-

Figure 3-4: Photo of Downstream Janes Creek (trail).
-

Figure 3-5: Photo of Downstream Janes Creek.


Results[edit | edit source]
Data was collected at the upstream and downstream sites over a four week period from October 12th to November 2nd, 2022. Data was also collected at the same locations earlier in the year, from March 9th to April 5th, 2022. The data collected in October and November will be referred to as Fall data, and the data collected in March and April will be referred to as Spring data. Parameters measured were dissolved oxygen (DO) concentration, DO saturation, temperature, conductivity, pH, salinity, turbidity, and total suspended solids (TSS). A major uncertainty in the data are the measured values for specific conductivity. Tables A-1 and A-2 show that upstream values for conductivity were 0 µS/cm for weeks 3 and 4 across all replicates. Downstream values were 0 for weeks 1, 2, and 4 across all three replicates. Additionally, week 1 values for the upstream site were all below 0 µS/cm, and one replicate for upstream week 2 was 0. The reason behind these low values is likely due to instrument error. These low values can be considered outliers amongst the conductivity data and were not taken into account when calculating the average, median, minimum, and maximum conductivity values. However, due to the fact that in certain weeks all replicates were outliers, some weeks will not have an average value or other calculated values in Appendix B.
The results of the data collection were condensed into six box and whisker plots depicting the spatial trends amongst both sites in the Fall and Spring data collection periods. These plots are located in the spatial trends section below. Figure 3-6 corresponds to dissolved oxygen concentration, Figure 3-7 to conductivity, Figure 3-8 to temperature, Figure 3-9 to TSS, Figure 3-10 to turbidity, and Figure 3-11 to pH.
-
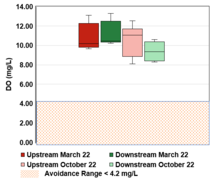
Figure 3-7: Dissolved oxygen concentration (mg/L). March 22 data was collected from March 9 to April 5 2022. October 22 data was collected from October 12 to November 2 2022. The sample size for each box is 12. The top whisker in each box delineates the maximum value for that site and time frame, and the bottom whisker delineates the minimum value. The horizontal line across the box delineated the median value. DO avoidance range for adult Chinook Salmon is below 4.2 mg/L (Carter 2005).
-
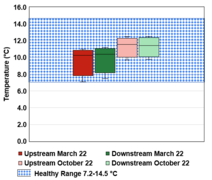
Figure 3-8: Temperature (℃). March 22 data was collected from March 9 to April 5 2022. October 22 data was collected from October 12 to November 2 2022. The sample size for each box is 12. The top whisker in each box delineates the maximum value for that site and time frame, and the bottom whisker delineates the minimum value. The horizontal line across the box delineated the median value. Healthy temperature range for adult Chinook Salmon is 7.2-14.5 ℃ (Bell 1986).
-
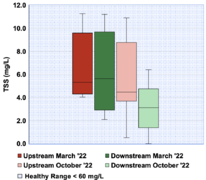
Figure 3-9: Total Suspended Solids (mg/L). October 22 data was collected from October 12 to November 2 2022. The sample size for each box is 12. The top whisker in each box delineates the maximum value for that site and time frame, and the bottom whisker delineates the minimum value. The horizontal line across the box delineated the median value. Healthy range of TSS for Atlantic Salmon is below 60 mg/L (Ye et al. 2005).
-
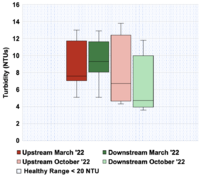
Figure 3-10: Turbidity (NTUs). October 22 data was collected from October 12 to November 2 2022. The sample size for each box is 12. The top whisker in each box delineates the maximum value for that site and time frame, and the bottom whisker delineates the minimum value. The horizontal line across the box delineated the median value. The healthy range for juvenile Coho Salmon is below 20 NTU (Berg 1982).
-

Figure 3-11: pH. October 22 data was collected from October 12 to November 2 2022. The sample size for each box is 12. The top whisker in each box delineates the maximum value for that site and time frame, and the bottom whisker delineates the minimum value. The horizontal line across the box delineated the median value. The healthy pH range for Chinook Salmon is 6.7-8.3 (Bell 1986).
-
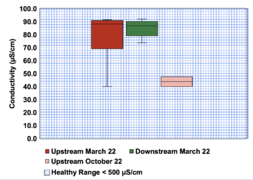
Figure 3-12: Specific Conductivity (µS/cm). October 22 data was collected from October 12 to November 2 2022. The sample size for the March upstream and downstream boxes is 12, while the sample size from the October upstream box is only 2. The top whisker in each box delineates the maximum value for that site and time frame, and the bottom whisker delineates the minimum value. The horizontal line across the box delineated the median value. The healthy range for rainbow trout embryos is below 500 µS/cm (Beach 2020).


Discussion[edit | edit source]
Figure 3-7 shows that the median dissolved oxygen concentration measured at the upstream site was higher than the dissolved oxygen concentration measured at the downstream site across the four week sampling period. Upstream concentration ranged from 8.08 to 12.53 mg/l, with a median value of 11.05 mg/L. Downstream concentrations ranged from 8.30 to 10.61 mg/L, with a median value of 9.34 mg/L. As addressed in the introduction, the park in between the upstream and downstream sampling sites is a potential source of pollution to Janes Creek and is a possible explanation for why this trend in dissolved oxygen is seen. An example of park activities contributing to creek pollution could include when the grass and brush area near the park and next to the creek are cut with mowers and weed wackers, and the waste organic matter produced by this could run off into the creek, increasing the biochemical oxygen demand and causing the dissolved oxygen concentration to decrease. However, TSS and turbidity data, shown in figures 3-9 and 3-10 respectively, do not support this as both Fall median values are lower in the downstream site than the upstream. DO concentration is subject to many factors such as temperature, time of day, water volume, season, plant abundance, and the presence of organic wastes (EPA 2022), so such a minor change in DO concentration between the two sites does not conclusively show that Meadows Park influenced the DO concentration in the creek. DO concentration data collected in Spring 2022, shown in Figure 3-7, included greater maximum values in both the upstream and downstream sites than the values collected in Fall 2022. The maximum value in the upstream site was 13.10 mg/L and 13.30 mg/L in the downstream site. Possible reasons for an increase in DO concentration in the spring are increased precipitation and lower temperatures. According to the precipitation data for the Eureka area (NOAA 2022), shown in Appendix C, the total precipitation was 1.49 inches in March and 4.57 inches in April. In October it was 0.14 inches and 3.96 inches in November. Figure 3-8 shows that the median temperatures recorded in Spring were lower than the medians in Fall. Colder water saturates with higher concentrations of DO, and DO tends to rise in surface waters with increased precipitation because rain saturates with oxygen as it falls (EPA 2022). Higher rainfall and creek flow also correlates with increased turbulence, which would increase the aeration of water in the creek and increase DO concentration. All recorded DO concentration values were greater than the avoidance range of 4.2 mg/L and below for adult Chinook Salmon (Carter 2005), which shows that this portion of the creek has healthy levels of DO for salmonids.
There was no observable difference in the temperature between the upstream and downstream sites. Figure 3-8 shows that the median temperature in the upstream site was 11.55 ℃ and 11.45 ℃ for the downstream site. The temperatures for both sites ranged from 9.7 ℃ to 12.5 ℃. Temperatures recording in Spring were lower than those recorded in Fall. In Spring, the median upstream temperature was 10.25 ℃ and ranged from 7.1 to 11.0 ℃. The median downstream temperature was 10.4 ℃ and ranged from 7.5 to 11.2 ℃. The median temperatures for both sites in Spring and Fall are within the healthy range of 7.2-14.5 ℃ for adult Chinook Salmon (Bell 1986), which shows that this portion of the creek has healthy temperature levels for salmonids.
Total suspended solids (TSS) decreased between the upstream and downstream sites. Figure 3-9 shows that the median TSS concentration for the upstream site was 4.5 mg/L and ranged from 0.5 to 10.9 mg/L. The median concentration for the downstream site was 3.1 mg/L and ranged from 0 to 6.4 mg/L. It is unlikely that some sort of pollution from Meadows Park or the surrounding residential area is affecting the TSS levels in the creek because the TSS levels are decreasing between the upstream and downstream sites. A potential explanation for the higher TSS levels in the upstream site is that the creek is somewhat narrower near that site, and has steeper, muddy banks on both sides of the creek. Dirt and mud runoff into the creek at this site could cause an increase in TSS. The median values for TSS collected in Spring were higher than those collected in Fall. Figure 3-9 shows that the median concentration in the upstream site was 5.32 mg/L, and the median concentration in the downstream site was 5.63 mg/L. Potential reasons for higher TSS values in the Spring are increased precipitation in Spring as discussed previously, which would lead to higher runoff into the creek. However, both spatial and temporal trends seen in the gathered data are not necessarily indicative of the effects of the park or residential area due to the process of how TSS is measured in-lab and how a very minor change in this process can produce dramatically different results. The TSS values for both sites were below the avoidance level of 60 mg/L for Atlantic salmon (Ye et al. 2005), so this portion of the creek has healthy levels of TSS for salmonids.
Turbidity is similar to TSS in that it also decreases from the upstream site to the downstream site for likely similar reasons. Figure 3-10 shows that the median turbidity for the upstream site was 6.7 NTUs and ranged from 4.3 to 13.8 NTUs. The median turbidity for the downstream site was 4.7 and ranged from 3.6 to 11.8 NTUs. Potential reasons for why the upstream site has higher turbidity is similar to why there is a higher concentration of TSS upstream, which is that the upstream site has steeper, muddier banks that erode more easily into the stream and increase the turbidity. Like for TSS, the median values for turbidity recorded in the spring were higher for both the upstream and downstream sites. This is likely due to increased precipitation in the Spring. The turbidity values for both sites is below the avoidance level of 20 NTUs for juvenile Coho Salmon (Berg 1982), so this portion of Janes Creek has healthy levels of turbidity for salmonids.
There was not a significant change in the pH of the creek between the upstream and downstream sites. Table B-2 shows that the median pH of the upstream site was 6.72 and the median pH of the downstream site was 6.71. The upstream pH ranged from 6.16 to 6.89, while the downstream pH ranged from 6.24 to 6.88. The pH recorded in Spring was lower than the pH recorded in the fall. Figure 3-11 shows that the Spring upstream median was 6.61 and the downstream median was 6.62. A potential reason for a lower pH in the Spring is the increased rainfall in the Spring. Rain is acidic and a higher rainfall could lead to a decrease in the pH of the creekwater. The median pH in both sites was just above the lower limit of the healthy range for Chinook salmon (Bell 1986) and greater than the lower limit of 5.5 for general fish species (Bell 1970). Therefore, it is fair to conclude that this portion of the creek has healthy pH levels for salmonids.
As mentioned in the results section, due to instrument error when gathering data for conductivity in the creek, many values were reported as 0 and can be considered outliers amongst the conductivity values and are not considered in analysis. However, due to how little data remains when not considered these values, it is difficult to interpret any trend amongst the data in regards to conductivity. However, when looking at the data collected in the Spring, there is no observable difference in the conductivity between sites. The median conductivity for the upstream site was 88.2 µS/cm, and the median conductivity for the downstream site 86.9 µS/cm. Based on this data, it is unlikely that Meadows Park or the surrounding residential area influenced the conductivity of the creek. The median conductivity values collected in the Spring are below the avoidance level of 300 µS/cm for rainbow trout embryos (Beach 2020), so this portion of the creek has healthy levels of conductivity for salmonids.
Conclusion[edit | edit source]
The objective of this project was to assess if and how Meadows Park and the surrounding residential area impact the water quality of Janes Creek, and if Janes Creek is a suitable habitat for salmonid species. Data collected over a four week period was analyzed and trends were interpreted from this data. The biggest potential impact that Meadows Park had on the water quality of the creek was in the dissolved oxygen concentration of the creek. There was a decrease in median DO concentration between the upstream and downstream sample sites, from 11.05 mg/L upstream to 9.34 mg/L downstream. However, because DO concentration is subject to a variety of factors, and because the difference in DO concentration between the two sites is minor, it cannot be conclusively said that Meadows Park or the surrounding residential area had an influence on the DO in Janes Creek. Comparing the data gathered to literature on the healthy ranges of these water quality parameters for salmonid species, it was concluded that all six discussed parameters were within the healthy ranges for salmonid species. Because of this, a conclusion can be made that this portion of Janes Creek is suitable salmonid habitat.
References[edit | edit source]
- Avkhimovich, D. (2013). Effect of water quality on rainbow trout performance: Water oxygen level in commercial trout farm “Kala ja marjapojat”.
- Brett, J. R., and J. M. Blackburn (1981). Oxygen Requirements for Growth of Young Coho (Oncorhynchus Kisutch) and Sockeye (O. Nerka) Salmon at 15 °C. Canadian Journal of Fisheries and Aquatic Sciences.
- Burt, Kim et al (2012). Environmental Conditions and Occurrence of Hypoxia Within Production Cages of Atlantic Salmon on the South Coast of Newfoundland. Aquaculture Research, Blackwell Science.
- Carter, K. (2005). The effects of dissolved oxygen on steelhead trout, Coho Salmon, and Chinook Salmon biology and function by life stage. California Regional Water Quality Control Board, North Coast Region, 10.
- Carter, K. (2008). Effects of temperature, dissolved oxygen/total dissolved gas, ammonia, and pH on salmonids. California Regional Water Quality Control Board, North Coast Region.
- EPA (1986). Quality Criteria for Water. Washington DC: Office of Water Regulations and Standards.
- Pacific Mountain System D Bieger. (2015). StreamStats Report. StreamStats. Retrieved October 25, 2022, from https://streamstats.usgs.gov/sUnited States Environmental Protection Agency. 2022. “Dissolved Oxygen.” Accessed November 30, 2022. https://www.epa.gov/caddis-vol2/dissolved-oxygen
Appendix A. Raw data[edit | edit source]
Raw data collected at the upstream and downstream sites in Fall 2022. Table A-1 includes the raw data for the upstream site.

Table A-1 continued (upstream).

Table A-2 includes the raw data for the downstream site.

Table A-2 continued (downstream).

Appendix B. Intermediate results[edit | edit source]
Table B-1: Intermediate results for upstream and downstream sites. Intermediate results include sample size, average, standard deviation, and standard error for each parameter.


Table B-1 continued.


Table B-2: Median, minimum, maximum values for upstream and downstream data for each parameter.


Appendix C. Previous data collection[edit | edit source]
Appendix C includes Table C-1, which details the precipitation data in the Eureka area for the year 2022, and Figure C-1, a plot of recorded temperatures in the Eureka area across the calendar year.
-
Table C-1: Monthly Total Precipitation for Eureka Area, CA (NOAA 2022). Data was taken from NOAA online weather database. Data is presented in sum inches for each month.
-
Table C-2: Monthly Mean Avg Temperature for Eureka Area, CA (NOAA 2022). Data was taken from NOAA online weather database. Temperature is reported as mean temperature in Fahrenheit for each month of 2022.
Appendix D. Sample calculations[edit | edit source]
Equation 1) Total Suspended Solids:

C = Weight of crucible
C = Weight of crucible
F = Filter
R = Residue after 24 hours at 105˙C
V = Sample Volume Filtered

Equation 2) Average:

S# = Sample number
S# = Sample number
n = Number of Samples

Equation 3) Standard deviation:

x = Value of Sample
x = Average value of Samples
n = number of samples

Equation 4) Standard error:

SD = Standard Deviation
n =number of samples
