Naturally occurring in the earth's crust, fluoride can often be found in the worlds water supplies. While innocuous and even beneficial in small amounts, when fluoride is consumed in excess by humans and animals it can cause varying degrees fluorosis. In an effort to combat this public health problem, various technologies have been explored in both the developing and developed world.
Fluorosis[edit | edit source]
Occurrences of Fluoride and Fluorosis[edit | edit source]
There are numerous fluoride "belts" throughout the world where groundwaters contain unsafe levels of fluoride. These belts span over 14 countries in Africa, 8 countries in Asia, and 6 countries in the Americas that all having water considered unsafe by the World Health Organization (WHO).[1]
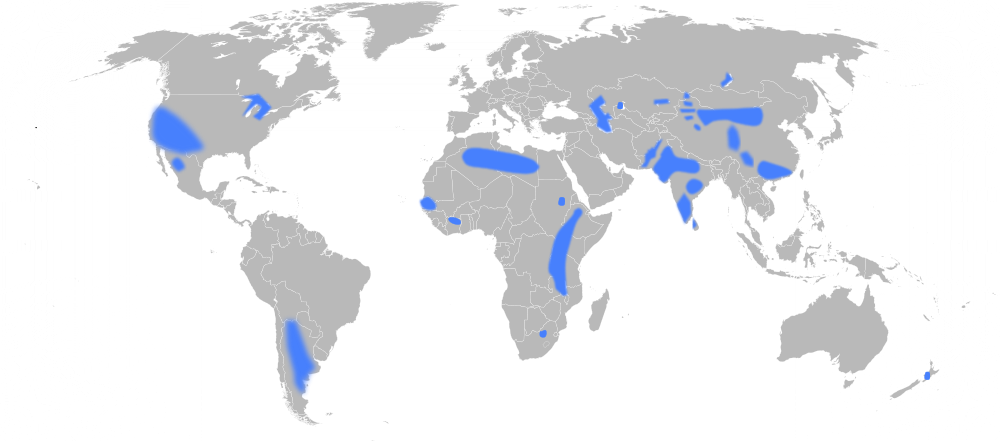
Regions of the World with Significant Levels of Fluoride in the Groundwater.
This fluoride typically occurs in the earths crusts as fluorspar(CaF2), rock phosphate, cryolite (Na3AlF6), apatite(Ca5(PO4)3F), mica, and hornblende.[2] Fluorine is the most electronegative element and is extremely reactive, rarely found outside of its ionic form, fluoride.[2]The fluoride then leaches off of these minerals and into the groundwater. The harmful effects of fluoride have been increasing worldwide. Though not exclusively a developing world problem, it is felt much more acutely in these regions as the infrastructure to deal with fluoride is often not equipped to deal with this problem. As the population of the developing world continues to climb, people are forced to move into fluorotic areas.
Fluoride can also contaminate ground and surface water from man-made causes such as mining and the use of certain pesticides.[2]
One of the regions of the world most affected by fluorosis is East Africa, specifically, the East African Rift Valley. Possibly because fluorotic minerals are often carried by water, it is more common to find fluoride rich soils in lowlands and valleys. (Conversely there is typically less fluoride in nearby highlands.) This phenomenon coupled with the high fluoride volcanic rocks in the East African Rift result in significant amounts of fluoride in the Rift Valley.[3] With over 61% of East African water sources having more than 1 mg of F /l (the recommended amount), 20% having more than 5 mg/l, and 12% having over 8mg/l.[2]
Causes of Fluorosis[edit | edit source]
It is common in the developed world to intentionally put fluoride into municipal water systems. It has been proven that with 1.0 mg of F/l(dependent on a few other factors) the overall instances of dental health in a community can be greatly improved by the added protection fluoride gives to tooth enamel.[2] In fact, fluoride in water is not considered toxic until it reaches concentrations of 250-450 mg/l.[4] However, because much of the fluoride consumed is retained by the body, it still has a cumulative effect when consumed in far smaller concentrations resulting in fluorosis. Though necessary for the body to function and proven to be helpful in smaller doses, the WHO recommends the ingestion of no more than 4.0 mg of fluoride per person per day.[5] Though much intake of fluoride comes from food, it has been shown that the majority of occurrences of fluorosis come from the consumption of water with excessive amounts of fluoride.[6] Thus, the WHO limits fluoride concentrations in drinking and cooking water to 1.5 mg F/l.[2] This limit is considered incomplete by many. It has been suggested that the optimum amount of fluoride in drinking water is approximately 0.5-1.0 mg/L.[1] Because it is not so much the concentration of the fluoride that is of concern, but rather the total fluoride consumed, it has been suggested that a "sliding scale" of acceptable levels of fluoride should be used based on the average maximum temperature.[3]
| Maximum Mean Temperature of Region (oC) | Maximum Recommended Concentration of Fluoride (mg F/l) |
|---|---|
| 0 | 2.1 |
| 10 | 1.3 |
| 20 | 0.9 |
| 30 | 0.7 |
| 40 | 0.6 |
| 50 | 0.5 |
| 60 | 0.4 |
Given this, it has been noted that those who live in hotter/humid climates and/or labor outdoors are far more likely to develop symptoms of fluorosis than those who do not.[7] This is because they consume far more water than those in other regions and lifestyles. Studies have also shown that children are typically the most affected by fluoride as their developing bones and teeth are more susceptible to the effects of fluorosis. In fact, it has been shown that the amount of fluoride consumed in one's first year of life has more impact than any other phase of life.[8] Other factors that have affected the severity of fluorosis in individuals are altitude of residence, nutritional status, and use of dentifrice.[9] It is estimated that about 60% (80-90% for infants) of fluoride ingested in person's body is retained while the rest is primarily expelled through urine.[2]
There are instances in which fluoride can be inhaled through the burning of coal. Fluoride inhalation can cause significant health problems, this problem is most evident in China.[2]
These problems are exacerbated in East Africa by the fact that the common foods used for weaning children are often fluoride rich.[10] Additionally, "Magadi" (Na2 NaHCO3H2O) is a salt used heavily in cooking that is typically collected from lakes or earth. Magadi is typically formed in the region's fluoride rich bodies of water and is a major source of fluoride intake for the peoples of the region.[5]
Dental Fluorosis[edit | edit source]
Dental fluorosis is by far the most common manifestation of over-consumption of fluoride. It is visible by white, yellow, and brown streaks on the teeth, characteristic of the hypoplasia and hypocalcification.
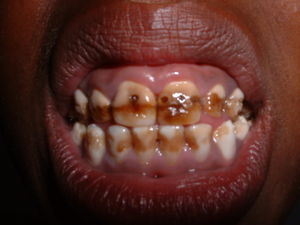
[11] This damage is more than cosmetic, as it tends to be associated with painful "cavity-like" feelings. Additionally, there are social stigmas against those suffering from fluorosis. It had once been postulated that men were more disposed to suffering from dental fluorosis than women, however, it is now believed that this inference was incorrect, and that women are more likely to try to hide the effects of fluorosis.[7]
While all teeth are affected, the incisors (especially the maxillary incisors) and permanenet molars are often the teeth most affected by fluorosis. It is speculated that this is because these are the first teeth to develop.[12]
Skeletal Fluorosis[edit | edit source]

Though it generally takes far more time, and higher concentrations (typically over 10mg/l[2])to develop, skeletal fluorosis is far more severe than its dental counterpart. Though not initially obvious to diagnose, skeletal fluorosis can be detected early on radiologically.[11] Skeletal fluorosis is characterized by deformation of bone structure. Movement of the spine, pelvis, and joints become increasing arduous as fluoride deposits collect on ligaments and tendons and within the bones themselves.[11] Skeletal fluorosis to the point of crippling is not uncommon.
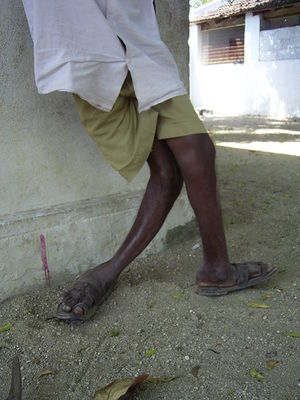
Fluorosis is non-curable,[13] thus efforts should be directed toward prevention and attempting to alleviate some of the symptoms.
Neurological complications[edit | edit source]
There are increasing accounts of the neurological affects that fluoride can have on the body. It is suspected that these complications are caused by fluorides effects on the spine and compression on the spinal cord.[14] Studies have shown that high levels of fluoride can cause headaches, isomnia, and reductions in the IQs of children.[15]
Fluorosis has significant economic impacts in the developing world. In addition to fluorosis removing people from the workforce, water supply programs have thrown away significant finances while providing costly boreholes that become useless upon the discovery of the toxic levels of fluoride that they contain.[16]
Perceptions and Education on Fluoride and Fluorosis[edit | edit source]
Because fluoride does not cause water to have any abnormal, taste, and odor, it is difficult to determine if water has significant fluoride concentrations. Because of this and the cumulative nature of fluoride as a toxin (that is, the results of consumption are not immediate), many peoples do not automatically connect water consumption to fluorosis. The effects of the disease have been attributed to a wide range of sources by different peoples including genetics, infection, and diet.[17](One people group in Kenya believe that fluorosis is caused by eating of potatoes that are too hot.)[17]
Therefore, there is a great need for education on and awareness of fluorosis in fluorotic areas and to connect water consumption to the symptoms of fluorosis. In many of these areas, little priority is given to water defluoridation because water sources are scarce enough that peoples are not concerned with water quality.[17]And because fluoride consumption has no immediate health effects and defluoridation methods are generally more time and money intensive than other water treatment types, there is generally a lack of motivation on the part of the people to be concerned with defluoridation.[17] Even when defluoridation methods are used, the lack of immediate results is a hindrance in encouraging the continued use of defluoridation.[18]
Measuring Fluoride[edit | edit source]
Because the presence of fluoride in water is tasteless, odorless, and color less, there is no way to identify the concentration of fluoride in a body of water without the use of instrumentation.[19] The use of a fluoride selective electorde is often considered the most reliable way of testing water for fluoride, though this method is difficult to do outside of a lab setting. The electrode consists of a lanthanum fluoride crystal (LaF6) that experiences a electro-potential when in the presence of fluoride ions.[19] Several methods have been developed for testing fluoride concentrations in the field. Most of these are colorimetric tests that result in fluoride interacting with chemicals and dyes such as the SPADNS method.[19] Though less accurate than an electrode, these methods can be used to evaluate if a body of water is safe to consume.[19]
Defluoridation[edit | edit source]
History of Defluoridation[edit | edit source]
The problem of fluorosis is nothing new as fluorosis is naturally occurring in ground water. Fluoride has been called "[...]one of the most widespread endemic health problems associated with natural geochemistry." Indeed, ancient skeletal remains in fluorotic areas exhibt signs of fluorosis.[20] Though an ancient problem, there were little formal attempts to defluoridate water before the 20th century. The problem of fluorosis was not necessarily identified until recent history. Some of the earliest diagnoses of dental fluorosis come from 1888 in Mexico and 1891 in Italy.[2] Still the link between drinking water and fluorosis wasnt established until the 1920s in Colorado, by dentist Dr. Fedrick S. McKay.[21] As many parts of the world where fluorosis is common are relatively isolated, many cultures in fluorotic regions never considered dental fluorosis to be an abnormality until increased communication and travel resulted in changes in perception.[7] Additionally, skeletal fluorosis can often take an extended time to develop visible symptoms, so it is not necessarily obvious for people to link fluorosis to a problem in water quality.[22] It was in the 1930s that several nations first began to more seriously investigate the negative effects of fluoride and how to remove it from drinking water supplies.[16]
Methods of Defluoridation[edit | edit source]
As with the treatment of other chemical contaminants, such as arsenic, fluoride cannot be removed by typical water treatment means. Boiling, UV treatment, most methods of filtration, and most chemical treatment options do nothing to remove fluoride concentrations from water. Synthetic ion exchange and precipitation processes, activated alumina filters, and reverse osmosis are typically used to remove fluoride from water in the developed world,[23] there is no universally accepted or routinely used defluoridation techniques in the developing world. Thus, defluoridation is a prime example of field in the need for further development of appropriate technologies. Ultimately social, financial, cultural, and environmental factors must all be weighed to determine what solutions should be implemented in a region.
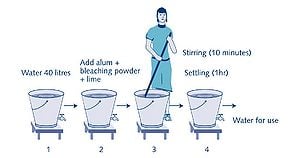
It must be noted that most of the defluoridation methods discussed here are point-of-use (POU) treatment options. These options are preferred for defluoridation in developing world settings. Though many POU treatments are done so to help reduce the risk of recontamination of water, defluoridation techniques, however, are typically POU because it helps to reduce costs. Because only water needed for drinking and cooking (about 25% of total water usage[24]) needs to be treated, municipal level treatment is rare. Still in some places a community scale defluoridation plan can be more appropriate. As with other methods of water treatment, the economics of the situation must be weighed to determine what scale is most appropriate.
Activated Alumina[edit | edit source]
Activated alumina is just what it sounds like, Alumina (Al2O3) that has been activated to become adsorbitive. The method of activation is done through dehydration of aluminum hydroxides at temperatures of 300-600oC.[24]
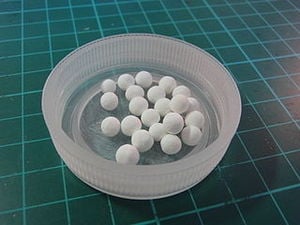
An extremely effective technology, activated alumina has been used in defluoridation since 1936 and was first used on a large scale in South Africa in the 1980s.[23] Though it is often used for large scale defluoridation in the developed world,[24]activated alumina has long been considered to not be an appropriate technology for use in the developing world because of chemical costs and availability. This technology is recently being reconsidered and is considered economically feasible for many in China, India, and Thailand.[25] This is probably due to higher level of infrastructure established in these countries needed to produce activated alumina. Still, costs prevent activated alumina from taking off in much of the developing world. However, the exploration of lower cost methods of producing activated alumina, as has been developed in one study Vietnam, may result in this technology becoming more accessible to more people.[26]
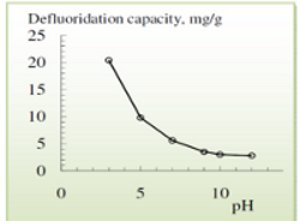
Activated alumina is used in an adsorption process with very high fluoride removal efficiency (able to treat water with fluoride concentrations from 4-20mg/L).[7] Though it has been used successfully to treat water for a number of contaminants,[4] it has the advantage of having a very high selectivity for fluoride.[27] The theoretical defluoridation capacity of the material increases with lower pHs (as high as 20.4 mg F/g at pH of 3), with any pH less than 9 resulting in a positive charge on the alumina surface that adsorbs the fluoride ions.[27] (It must be noted that the operational capacities observed in the field for activated alumina are often much lower than the theoretical values, being as low as 1 mg/g.[2])
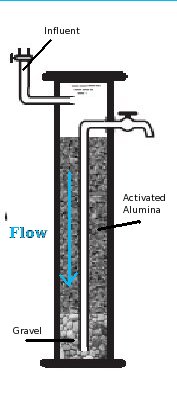
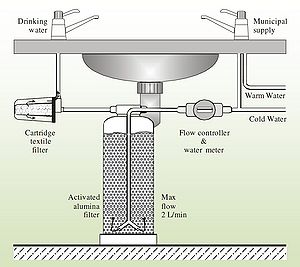
Though configurations may vary, activated alumina is typically used in a gravity fed column filter.
[28]
Though it depends entirely on the demands put on the filter, activated alumina filter media typically has to be replaced every few moths. Activated alumina has been shown to be successfully regenerated using hydrochloric acid (2%),sulphuric acid (1%), and sodium hydroxide (2%) solutions that create a strong negative charge on the alumina surface, removing the fluoride ions.[27] It should be noted that 5-10% of the media is lost in the regeneration process.[25] The remaining media has been shown to lose 30-40% of its capacity, thus activated alumina can only be used 3-4 times before it must be replaced, though it is common to mix regenerated media with fresh media.[25]
Below is a set of sample design calculations for the construction of an activated alumina column filter
| Given Parameters: | Unit | Column Filter | |
|---|---|---|---|
| D | Daily personal water demand | L/(c x d) | 3 |
| N | Number of users | p | 6 |
| OP | Operation period months | months | 3 |
| LT | Theoretical sorption capacity | g/kg | 4 |
| Lo | Operational sorption capacity | g/kg | 1 |
| s | Bulk density of medium | kg/L | 1.2 |
| Fi | Raw water fluoride conc. | mg/L | 5 |
| Ft | Treated water average fluoride conc. | mg/L | 0.2 |
| VRSW/M | Volume ratio supernatant water/meduym | ||
| 0.2 | |||
| VRCW/M | Volume ratio clean water container medium | ||
| 0 | |||
| Derived Parameters | |||
| Q= D x N | Daily Water Treatment | L/d | 18 |
| VT= OP x Q | Total volume of water treated in a filter | L | 1620 |
| FT= VT (Fi-Ft)/1000 | Total fluoride removal during a period | g | 8 |
| M= FT/LO | Amount of medium required for renewal | kg | 8 |
| VM= M/s | Volume of medium in the filter | 7 | 35 |
| BV= VT/VM | Number of bed volumes treated in a filter period | ||
| 250 | |||
| VSW= VRSW/MxVM | Volume capacity of supernatant water | L | 1.5 |
| VCW= VCW/M/VM | Volume capacity of clean water container | L | 0 |
| VF= VM+VSW+VCW | Total Volume of filter | L | 8 |
| Corresponding dimensions: | |||
| Ø | Filter diameter (selected as available) | cm | 12 |
| HF= VF/[pi x (Ø/2)2] | Total height of the filter | cm | 69 |
- ---
Bone Char[edit | edit source]
Bone char is the oldest known technology for water defluoridation, being successfully used since the 1940s.[2] It has been utilized successfully for at least 5 decades and was at one point used heavily in the United States for municipal water defluoridation and sugar refining.[30] Bone char has also been used successfully in the removal of arsenic from water.
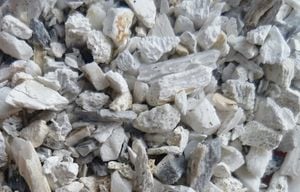
Bone char is produced with animal bones that have passed through calcination or pyrolysis processes. Though raw bones have some defluoridation value, it is small and limited by the various organics obstructing the interfaces where chemical reactions with the fluoride take place.[30]
In order to produce bone char, animal bones must first be collected. These bones can be collected from a variety of sources including butchers, restaurants, ranchers, etc. This can create an entirely new market by giving value to what was previously viewed primarily as a waste material.
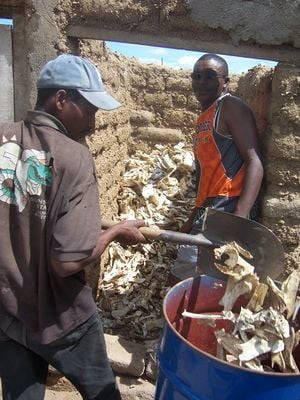
Once the bones are collected, they are often washed, rinsed, boiled, or sun dried to remove much of the organics before they are actually charred to be used as filter media. Many different animal bones can work, as the uptake of fluoride hinges upon a reaction with hydroxyapatite (Ca10(PO4)6(OH)2), a mineral found in all bones. One study showed that there is slight variability seen in the capacity of char made from different animals, with cows and pigs yielding char with more capacity than chicken and fish, but the differences are often regarded as minor.[31] There can be significant cultural reasons to select one animal bone type over another. Bone char made from cattle may be a problematic for Hindus, char made from pigs may not be accepted by Muslim and Jewish communities, and char from dogs and hyenas may be rejected in many African communities..[2]
Calcination is the process of subjecting the bones to high temperatures(300-700oC) with atmospheric oxygen present..[30] This results in a bone char product that is chiefly just hydoxyapatite with the organics burning off as CO2.[32] Hydoxyapatite is the primary mineral component of bones and the mineral in which an ion exchange with fluoride takes place.[30] There is significant variability is the quality of calcined bone char in terms of fluoride uptake.
Pyrolytic bone char is bone char that has been charred in the absence of oxygen. Though potentially more complicated to produced, it has proven to be much more desirable than calcined bone char. Rather than burning the organic materials, pyrolysis results in the conversion of organic materials into a usable activated carbon, which can treat the water beyond fluoride.[30] A well done batch of pyrolytic bone char should result in about 10% activated carbon with the rest chiefly being hydroxyapatite for the fluoride ion exchange process.[30] The quality of pyrolytic bone char is far less variable than that which has been calcined. Additionally, it loses less mass (31% as opposed to the 38% of mass lost in calcination) and capacity through the charring process.[30]
The difference between pyrolytic and calcined bone char is not necessarily black and white. (No pun intended.) Pure pyrolysis results in black bone char will be most likely due to the increased amount of graphite (activated carbon) that is present, while calcination can vary in color form white to dark grey.[30] As implied, generally the closer the charring process is to pure pyrolysis the better. Not only does this result in higher quality bone char in terms of fluoride removal capacity, but in terms of activated carbon present as well.
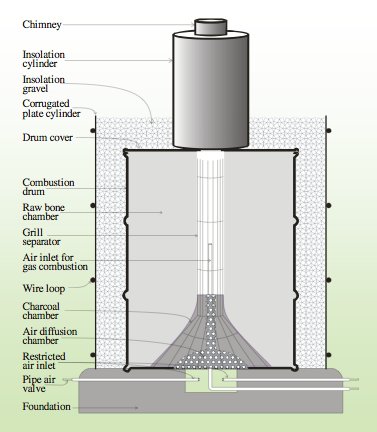
That being said, true pyrolysis is difficult to achieve on a large scale in the furnaces used in the developing world. Pyrolysis requires far more fuel, and therefore is far more expensive.[33] Thus, there are virtually no large scale furnaces in use designed for the pyrolysis of bone char. Efforts are still typically made in the construction of furnaces to significantly control the inflow of air to these furnaces, but because some atmospheric oxygen is used in the preparation of bone char it is always a calcination process. Generally the ratio of fuel (typically charcoal) to bones is about 8%.[34] There have been numerous studies on what temperatures and charring times produce the best quality bone char, and though the numbers vary most agree that charring temperatures for bones should not be much beyond 500oC because at this point the effectiveness in fluoride removal is compromised.[33]

The amount of time the charring is done can vary significantly depending on the quantity of bones being charred and the desired quality. Typically the total charring time is a matter of days, with perhaps a few hours actually at the maximum temperature because it takes a long time to heat up the massive furnaces.

Once charred, the bones are then crushed and sieved to achieve desired sizes. As with the temperature there are variations in what is considered to be the optimal grain size for bone char use in defluoridation. Most sources agree that the use of 0.5-4 mm diameter grains can and should be used with both effectiveness and economics in mind.[34]
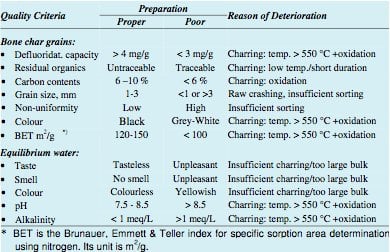
It has actually been shown that the grain size has no bearing on the dynamic capacity of the bone char, but rather it is the reaction rate that is affected.[35] The reaction rate constant is nearly reciprocal of the grain diameter. That is, smaller diameters result in quicker reactions.[35] Too small of a grain size can result in too much head loss when the char is used as a filter media, so care must be taken to ensure that the grain sizes of the media are not so small as to clog the filter.
As mentioned, the crushed bone char is then used as a filter media. Typically bone char filters are designed as gravity-fed column filters, though there have been a few different configurations implemented.
-
Bucket Filter
-
Drum Filter
-
Column Filter
The primary difference exists between the first two filters and the column filter. The column filters more closely resembles a plug flow reactor, while the other two have more of a mixed flow.[25] Thus, the column filters generally make more efficient use of the filter media. In order to estimate the life of filter media when designing a filter the operational defluoridation capacity of a filter is estimated from the theoretical defluoridation capacity. The theoretical capacity is calculated based on scaling up the amount of fluoride that each grain of bone char can hold. A proposed rule of thumb is that the closer a filter is to being a column filter (and therefore a plug flow reactor) the operational defluoridation capacity is 2/3 the theoretical defluoridation capacity (Typical capacity of 2-6 mg F/g for bone char.[36]) , while the bucket and drum filters have a operational defluoridation capacity closer to 1/3 the theoretical defluoridation capacity.[25] There are a number of design parameters critical in the construction of a bone char filter.
The primary advantages to making a bucket or drum filter all lie in the filter construction. Because the filter unit themselves can be made from a wide variety of materials, it is often far easier to use cheap and readily available containers to make filters, rather than the custom manufacturing of a column filter.[25]
It is recommended that bone char filters be rinsed through a few times before they are actually used as there may be some residual organic materials in the char that may negatively affect the taste of the water. Though this should not be a concern if the charring process was done well.[34] (Pyrolytic bone char yields no odors or unpleasant taste.)[30] Due to variations in the charring process, the actual chemical composition of bone char can vary slightly. Generally its composition is:
57-80% Hydroxyapatite (Ca10(PO4)6(OH)2
6-10% Calcium Carbonate(Ca(CO3))
7-10% Activated Carbon[2]
Though some adsorption of fluoride occurs onto the activated carbon, the primary uptake reaction is believed to be an ion exchange between the hydroxyapatite and fluoride resulting in the formation of fluorapatite.
Ca10(PO4)6(OH)2 + 2F- => Ca10(PO4)6F2 + 2 OH-
This reaction readily occurs due to the fact that fluoride and hydroxide ions have the same charge and radius,[4] and hydroxyapatite is more soluble than fluorapatite.[37] Obviously this results in a pH shift in the water to become more alkaline. (This shift is more pronounced with bones that have been poorly calcined than those which were subject to pyrolysis, probably because there is destruction of the apatite structures that result in increased calcium oxide in the water.[30])
This reaction can be reversed to regenerate the saturated bone char media. By adding 1% NaOH to saturated bone char, another ion exchange happens.[36]
Ca10(PO4)6F2 + OH- => Ca10(PO4)6(OH)2 + 2F-
This process results in extremely high pHs (upwards of 13) which are then slowly lowered by rinsing the regenerated bone char with distilled and CO2 enriched water.[38] The fluoride rich sodium hydroxide solution can then be subjected to additions of Ca(OH)2 and CaCl2 which will react with the Fluoride to precipitate out as CaF2, thus allowing the NaOH solution to be reused.[38] It has been shown that this form of regeneration can be successfully used on bone char for several hundred cycles.[36]Generally the regeneration of bone char has only been implemented on large scale or community systems because of the complexities of the process, the close monitoring required, and the cost effectiveness.[2]
Bone char has also been successfully regenerated by recharring depleted bone char. The suspected reaction taking place can be seen below.
Ca10(PO4)6F2 +2OH- + heat => Ca10(PO4)6-2 +2HF+O2
Though successful, bone char can only be successfully regenerated through this method for a few times as there are significant losses in efficiency after each regeneration.[39]
Like activated alumina, bone char filter media needs to be replaced or regenerated regularly, every few months to few years depending on the construction of the filter and the demand from it.
Bone char has been successfully implemented on some scale in many parts of the world, especially Thailand and Africa, yet there remains to be a successful wide scale implementation of this technology.[2]
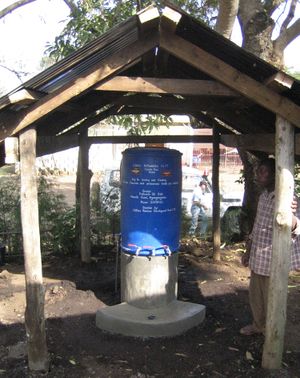
Many of the obstacles this technology faces are related to social acceptance. As mentioned many will not consume water treated by the bones of specific animals for religious and cultural reasons. Additionally, when poorly quality bone char can result in treated water having flavor issues, leaving a bad taste in the mouths of those who sampled this technology. When not appropriately managed, the charring process itself is also capable producing horrible odors[22] and can negative associations with cremation in the minds of some users.[22] Still, this technology has the advantages of being simple, relatively cheap, readily available, and potentially able to treat water beyond reducing fluoride when processed properly and regenerated. Having the infrastructure in place to create, maintain, and regenerate the filtered media is necessary to see the widespread adoption of this technology. Examples of an effort to create this infrastructure would be the Catholic Diocese Network (CDN) in Nakuru, Kenya[38] and the fledgling enterprise of Umoja Engineering (affiliated with the Defluoridation Technology Project.)
The CDN in Nakuru, Kenya represents one of the more successful efforts to develop and disseminate bone char technology and defluoridation in general. Approaching the problem of fluorosis from all angles, the CDN has heavily invested in education and awareness initiatives in the region. These efforts include the development of a fluoride education theatre group that are able to educate in a way that is appreciated and understood by many different groups in their communities.[17] The CDN has focused on collaboration with the local communities in bone char and bone char filter production and implementation. As mentioned, they have set up the infrastructure necessary to making bone char available by creating a centralized bone char processing and regeneration facility where filter media can be sold at low prices to the general public while still maintaing quality control over the bone char.[40] The CDN has both community size and household filters successfully in use in the field.[40] That being said, the CDN's efforts in bone char dissemination are not without problems. Because it is based out of one central processing facility and is receiving no income beyond that which cover expenses, the CDN's operational model is unable to grow and is considered to be unsustainable.[40]
Below is a sample calculation for 3 types of bone char filters. It is assumed that the theoretical sorption capacity is 6 mg F/g.
| Given Parameters: | Unit | Drum Type | Bucket Type | Column Filter | |
|---|---|---|---|---|---|
| D | Daily personal water demand | L/(c x d) | 3 | 3 | 3 |
| N | Number of users | p | 6 | 6 | 6 |
| OP | Operation period months | months | 12 | 3 | 6 |
| LT | Theoretical sorption capacity | g/kg | 6 | 6 | 6 |
| Lo | Operational sorption capacity | g/kg | 2 | 2 | 4 |
| s | Bulk density of medium | kg/L | 0.83 | 0.83 | 0.83 |
| Fi | Raw water fluoride conc. | mg/L | 10 | 10 | 10 |
| Ft | Treated water average fluoride conc. | mg/L | 1 | 1 | 1 |
| VRSW/M | Volume ratio supernatant water/meduym | ||||
| 2 | 2.5 | 0.2 | |||
| VRCW/M | Volume ratio clean water container medium | ||||
| 0 | 3.5 | 0 | |||
| Derived Parameters | |||||
| Q= D x N | Daily Water Treatment | L/d | 18 | 18 | 18 |
| VT= OP x Q | Total volume of water treated in a filter | L | 6500 | 1600 | 3200 |
| FT= VT (Fi-t)/1000 | Total fluoride removal during a period | g | 60 | 15 | 30 |
| M= FT/LO | Amount of medium required for renewal | kg | 30 | 7 | 7 |
| VM= M/s | Volume of medium in the filter | L | 35 | 9 | 9 |
| BV= VT/VM | Number of bed volumes treated in a filter period | ||||
| 185 | 185 | 370 | |||
| VSW= VRSW/M/VM | Volume capacity of supernatant water | L | 70 | 22 | 2 |
| VCW= VCW/M/VM | Volume capacity of clean water container | L | 0 | 31 | 0 |
| VF= VM+VSW+VCW | Total Volume of filter | L | 105 | 62 | 11 |
| Corresponding dimensions: | |||||
| Ø | Filter diameter (selected as available) | cm | 42 | 32 | 12 |
| HF= VF/[pi x (Ø/2)2] | Total height of the filter | cm | 75 | 75 | 92 |
- ↑ 1.0 1.1 R Tekle-Haimanot*, A. F., B Bushera and Y Mekonnen (1995). FLUORIDE LEVELS IN WATER AND ENDEMIC FLUOROSIS IN ETHIOPIAN RIFT VALLEY. 1st International Workshop on Fluorosis Prevention and Defluoridation of Water, Ngurdoto, Tanzania, The International Society for Fluoride Research.
- ↑ 2.00 2.01 2.02 2.03 2.04 2.05 2.06 2.07 2.08 2.09 2.10 2.11 2.12 2.13 2.14 2.15 J. Fawell, K. B., J. Chilton, E. Dahi, and L. F. a. Y. Magara (2006). Fluoride in Drinking-water. London, IWA Publishing.
- ↑ 3.0 3.1 Bårdsen, K. B. a. A. (1995). USE OF ACTIVATED CLAY FOR DEFLUORIDATION OF WATER. 1st International Workshop on Fluorosis Prevention and Defluoridation of Water, Ngurdoto, Tanzania, The International Society for Fluoride Research.
- ↑ 4.0 4.1 4.2 Crittenden, J. C., R. Rhodes Trussell, David W. Hand, Kerry J. Howe, and George Tchobanoglous (2005). Water Treatment: Principles and Design, John Wiley and Sons, Inc.
- ↑ 5.0 5.1 Dahi*, J. M. N. E. (1997). FLUORIDE CONTAMINATION AND MINERALOGICAL COMPOSITION OF EAST AFRICAN MAGADI (TRONA). 2nd International Workshop on Fluorosis Prevention and Defluoridation of Water, Nazreth, Ethiopia, The International Society for Fluoride Research.
- ↑ G.Karthikeyan*, A. P. a. B. V. A. R. (1997). A SIMPLE METHOD FOR DETERMINATION OF TOTAL FLUORIDE INTAKE. 2nd International Workshop on Fluorosis Prevention and Defluoridation of Water, Nazreth, Ethiopia, The International Society for Fluoride Research.
- ↑ 7.0 7.1 7.2 7.3 Chikte*, A. J. L. a. U. M. E. (1997). FLUORIDE AND FLUOROSIS: THE STATUS OF RESEARCH IN SOUTH AFRICA. 2nd International Workshop on Fluorosis Prevention and Defluoridation of Water, Nazreth, Ethiopia, The International Society for Fluoride Research.
- ↑ Bjorvatn, A. B. a. K. (1997). DENTAL FLUOROSIS IN SUBJECTS EXPOSED TO FLUORIDE CONTAINING DRINKING WATER AT DIFFERENT AGE. 2nd International Workshop on Fluorosis Prevention and Defluoridation of Water, Nazreth, Ethiopia, The International Society for Fluoride Research.
- ↑ M C Rwenyonyi, K. B., J M Birkeland and O Haugejorden (1997). DENTAL FLUOROSIS IN RELATION TO ALTITUDE AND FLUORIDE IN DRINKING WATER IN UGANDA. 2nd International Workshop on Fluorosis Prevention and Defluoridation of Water, Nazreth, Ethiopia, The International Society for Fluoride Research.
- ↑ M Wandera*, M. K. M. a. K. B. (1997). ASSESSMENT OF THE FLUORIDE CONTENT OF WEANING FOOD ITEMS IN WESTERN UGANDA. 2nd International Workshop on Fluorosis Prevention and Defluoridation of Water, Nazreth, Ethiopia, The International Society for Fluoride Research.
- ↑ 11.0 11.1 11.2 W Fantaye*, G. S., and R Tekle-Haimanot PREVALENCE OF DENTAL FLUOROSIS IN THE WONJI SHOA SUGAR ESTATE. 2nd International Workshop on Fluorosis Prevention and Defluoridation of Water, Nazreth, Ethiopia, The International Society for Fluoride Research.
- ↑ A K Awadia, K. B., * J M Birkeland* and O Haugejorden (1997). DENTAL FLUOROSIS WITH SPECIAL REFERENCE TO INCISORS AND MOLARS OF TANZANIAN SCHOOL CHILDREN. 2nd International Workshop on Fluorosis Prevention and Defluoridation of Water, Nazreth, Ethiopia, The International Society for Fluoride Research.
- ↑ http://web.archive.org/web/20160716231524/http://www.northsouth.ethz.ch:80/news/past_events/ann_conf_08/WPQ3_Osterwalder.pdf
- ↑ Z Meklau*, R. T. H., and G Shifera (1997). PREVALENCE OF LOW BACK PAIN AT AN AGRO-INDUSTRIAL COMMUNITY IN THE RIFT VALLEY. 2nd International Workshop on Fluorosis Prevention and Defluoridation of Water, Nazreth, Ethiopia, The International Society for Fluoride Research.
- ↑ JD Sharma, D. S., Parul Jain (2009). "PREVALENCE OF NEUROLOGICAL MANIFESTATIONS IN A HUMAN POPULATION EXPOSED TO FLUORIDE IN DRINKING WATER." International Society for Fluoride Research 42(2): 127-132.
- ↑ 16.0 16.1 Mkongo, F. J. G. a. G. (1995). WATER DEFLUORIDATION FOR RURAL FLUORIDE AFFECTED COMMUNITIES IN TANZANIA. The 1st International Workshop on Fluorosis Prevention and Defluoridation of Water, Ngurdoto, Tanzania, The International Society for Fluoride Research.
- ↑ H Bregnhøj* (1997). CRITICAL SUSTAINABILITY PARAMETERS IN DEFLUORIDATION OF DRINKING WATER. 2nd International Workshop on Fluorosis Prevention and Defluoridation of Water, Nazreth, Ethiopia, The International Society for Fluoride Research.
- ↑ 19.0 19.1 19.2 19.3 E Dahi *, Y. M. a. G. M. (2004). Credibility and Limitations of Fluoride Analysis Using the Pack Test! Kit. Proceedings of the 4th International Workshop on Fluorosis Prevention and Defluoridation of Water, Colombo, Sri Lanka, The International Society for Fluoride Research, ISFR Environmental Development Co-operation Group, EnDeCo Intercountry Centre for Oral Health, ICOH.
- ↑ http://historymedmysteries.blogspot.com/2008/04/fluorosis-problem-for-ancient-palmyrans.html
- ↑ Jerry R Taricska, L. K. W., Yung-Tse Hung, and Kathleen Hung Li (2006). Fluoridation and Defluoridation. Advanced Physicochemical Treatment Processes. New York, Springer-Verlag. 4.
- ↑ 22.0 22.1 22.2 Rajchagool, S. R. a. C. (1997). SOLVING THE FLUOROSIS PROBLEM IN A DEVELOPING COUNTRY. 2nd International Workshop on Fluorosis Prevention and Defluoridation of Water, Nazreth, Ethiopia, The International Society for Fluoride Research.
- ↑ 23.0 23.1 L. Feenstra, L. V., J. Griffioen (2007). Fluoride in groundwater: Overview and evaluation of removal methods. Utrecht, The Netherlands, International Groundwater Resources Assessment Centre: 25.
- ↑ 24.0 24.1 24.2 http://www.samsamwater.com/library/TP40_22_Technologies_for_fluoride_removal.pdf
- ↑ 25.0 25.1 25.2 25.3 25.4 25.5 25.6 Dahi, E. (2000). The State of Art of Small Community Defluoridation of Drinking Water. 3rd International Workshop on Fluorosis Prevention and Defluoridation of Water, Chiang Mai, Thailand, The International Society for Fluoride Research Environmental Development Co-operation Group Intercountry Centre for Oral Health.
- ↑ N V Dzung a, H. H. P., N N Long, N T Quang and P Waldemar (2004). Domestic Defluoridation of Water Using Locally Produced Activated Alumina. The 4th International Workshop on Fluorosis Prevention and Defluoridation of Water, Colombo, Sri Lanka, The International Society for Fluoride Research Environmental Development Co-operation Group.
- ↑ 27.0 27.1 27.2 G Karthikeyan', B. V. A. a. S. M. (1997). DEFLUORIDATION PROPERTIES OF ACTIVATED ALUMINA. 2nd International Workshop on Fluorosis Prevention and Defluoridation of Water, Nazreth, Ethiopia, The International Society for Fluoride Research.
- ↑ FABRICATION AND TESTING OF INTERMEDIATE LEVEL ACTIVATED ALUMINA BASED DEFLUORIDATION FILTERS AGRAWAL, R; MARGANDAN, K; SINGH, K; ACHARYA, R; SHARMA, S; Qanungo, Kushal, Tchê Química, Vol. 10, No. 19, p65-80. [1] Improvement of User Friendliness of a Simple Domestic Defluoridation Unit Using Activated Alumina, World Journal of Applied Environmental Chemistry,R. Agrawal, K. Margandan, K.Singh, R. Acharya, S. Sharma, Kushal Qanungo, Vol. 2, Issue 1,2013, p1-7
- ↑ Values derived and worked backwords from values seen in reference numbers [2] and [25]
- ↑ 30.0 30.1 30.2 30.3 30.4 30.5 30.6 30.7 30.8 30.9 Bregnhøj, E. D. a. H. (1995). SIGNIFICANCE OF OXYGEN IN PROCESSING OF BONE CHAR FOR DEFLUORIDATION OF WATER. The 1st International Workshop on Fluorosis Prevention and Defluoridation of Water, Ngurdoto, Tanzania, The International Society for Fluoride Research.
- ↑ Naohito Kawasaki, F. O., Hisato Tominaga, and Isao Yamaguchi (2009). "Removal of Fluoride Ion by Bone Char Produced from Animal Biomass." Journal of Oleo Science 58(10): 6.
- ↑ Osiriphan, W. P. a. N. (1997). PREPARATION OF BONE CHAR BY CALCINATION. 2nd International Workshop on Fluorosis Prevention and Defluoridation of Water, Nazreth, Ethiopia, The International Society for Fluoride Research.
- ↑ 33.0 33.1 Kongpun, J. A. H. B. a. M. (2000). Bone Char Quality and Defluoridation Capacity in Contact Precipitation. 3rd International Workshop on Fluorosis Prevention and Defluoridation of Water, Chiang Mai, Thailand, The International Society for Fluoride Research Environmental Development Co-operation Group Intercountry Centre for Oral Health.
- ↑ 34.0 34.1 34.2 H. Mjengera *, G. M. (2003). "Appropriate deflouridation technology for use in flourotic areas in Tanzania." Physics and Chemistry of the Earth 28: 1097–1104.
- ↑ 35.0 35.1 Dahi, H. B. a. E. (1995). KINETICS OF UPTAKE OF FLUORIDE ON BONE CHAR IN BATCH. 1stInternational Workshop on Fluorosis Prevention and Defluoridation of Water. Arusha, Tanzania, International Societ of Fluoride Research.
- ↑ 36.0 36.1 36.2 Dahi, P. J. a. E. (1997). EFFECT OF CALCIUM ADDITION ON THE DEFLUORIDATION CAPACITY OF BONE CHAR. 2nd International Workshop on Fluorosis Prevention and Defluoridation of Water, Nazreth, Ethiopia, The International Society for Fluoride Research.
- ↑ Bhargava, D. S. (1997). ECONOMICAL TECHNOLOGY OF FLUORIDE REMOVAL USING FISHBONE CHARCOAL COLUMNS AT DOMESTIC LEVEL. 2nd International Workshop on Fluorosis Prevention and Defluoridation of Water, Nazreth, Ethiopia, The International Society for Fluoride Research.
- ↑ 38.0 38.1 38.2 Catholic Diocese of Nakuru, W. Q. a. K. M. (2007). CDN's EXPERIENCES IN PRODUCING BONE CHAR. P. Jacobsen, Catholic Diocese Network.
- ↑ 39.0 39.1 Kaseva, M. E. (2006). "Optimization of Regenerated Bone Char for Fluoride Removal in Drinking Water: A Case Study in Tanzania." Journal of Water and Health 4(1): 9.
- ↑ 40.0 40.1 40.2 ARRENBERG, Alice. PRODUCTION MODELS FOR BONE CHAR DEFLUORIDATION, NAIVSHA, KENYA. (2010). Cranfield University


