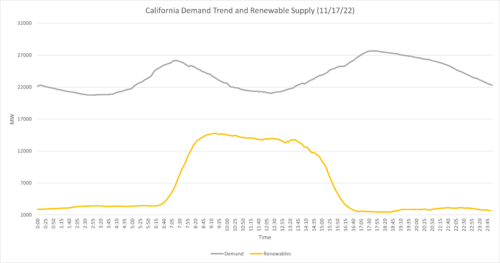
The Duck Curve is the electricity demand curve that occurs throughout the day while using photovoltaic energy generation. The concept is commonly used to emphasize the timing imbalance between peak energy demand and the timing of Photovoltaic (PV) generation[1].
Solar Generation[edit | edit source]
Solar generation typically peaks during solar noon, which is the moment when the sun is at its highest point in the sky. During solar noon, solar radiation is as concentrated and direct as it will get throughout the day. Peak PV generation during solar noon typically occurs when energy demand is at its lowest. During low energy demand periods, there is a potential for solar generation to over generate electricity[2].
Peak energy demand typically occurs during the evening hours of the day due to the influx of people using electronics at home. Peak energy demand coincides with the cessation of solar generation as the sun begins to set. This results in an increasingly steep ramp from low energy demand to peak energy demand which creates a challenge for utilities that need to meet an increasingly steep energy demand peak.
Mitigation Techniques[edit | edit source]
- Energy Storage Technologies: Excess energy generation can be stored during minimum demand and released later during periods of high demand. This will enable utilities to increase their solar generation and reduce the ramp up period during peak energy demand[3].
- Local Energy Programs - Demand Response: Energy behavior can be managed using apps that allow utility companies to communicate with customers[4]. Utility companies can incentivize a reduction in demand during peak demand by informing customers when electricity is at it's most expensive in real time. Utility companies can use a time of use pricing model that sets the price of a kwh highest during peak generation periods and lowest during minimum generation periods. This will allow customers to play the energy market which will incentivize energy use during minimum demand periods[5].
- Grid Friendly Solar Panel Orientation: Solar panels can be oriented in such a way as to decrease their energy production during minimum peak periods to avoid over generation. Solar panel orientation can reduce ramping by 25-30%[6]. This technique could be useful if their is limited deployment of energy storage technologies.
- Pre-cooling of Residential Households: Air conditioning is responsible for a large amount of electricity demand in places like California and Texas. Pre-cooling is a method where air conditioning is run during minimum demand periods to cool the house and then subsequently turned off during peak demand periods[7][8]. Well insulated households will remain cool into the evening. This strategy aims to reduce the electricity demand spike that occurs as people get home and turn on their air conditioning in the evening.
See also[edit | edit source]
References[edit | edit source]
- ↑ Hou, Q., Zhang, N., Du, E., Miao, M., Peng, F., & Kang, C. (2019). Probabilistic duck curve in high PV penetration power system: Concept, modeling, and empirical analysis in China. Applied Energy, 242, 205–215. https://doi.org/10.1016/j.apenergy.2019.03.067
- ↑ Golden, M. (2016, January 21). How energy efficiency can help manage the duck curve. Greentech Media. Retrieved December 4, 2022, from https://www.greentechmedia.com/articles/read/the-grid-has-changed-how-energy-efficiency-can-help-manage-the-duck
- ↑ Kosowatz, J. (2018). Energy storage smooths the duck curve. Mechanical Engineering, 140(06), 30–35. https://doi.org/10.1115/1.2018-jun-1
- ↑ Krietemeyer, B., Dedrick, J., Sabaghian, E., & Rakha, T. (2021). Managing the duck curve: Energy culture and participation in local energy management programs in the United States. Energy Research & Social Science, 79, 102055. https://doi.org/10.1016/j.erss.2021.102055
- ↑ Datchanamoorthy, S., Kumar, S., Ozturk, Y., & Lee, G. (2011). Optimal Time-of-use pricing for residential load control. 2011 IEEE International Conference on Smart Grid Communications (SmartGridComm). https://doi.org/10.1109/smartgridcomm.2011.6102350
- ↑ Doroshenko, M., Keshav, S., & Rosenberg, C. (2018). Flattening the duck curve using grid-friendly solar panel orientation. Proceedings of the Ninth International Conference on Future Energy Systems. https://doi.org/10.1145/3208903.3212029
- ↑ Naderi, S., Heslop, S., Chen, D., MacGill, I., & Pignatta, G. (2021). Cost-saving through pre-cooling: A case study of sydney. The 3rd Built Environment Research Forum. https://doi.org/10.3390/environsciproc2021012002
- ↑ Calero, I., Canizares, C., Bhattacharya, K., & Baldick, R. (2022). Duck-curve mitigation in power grids with high penetration of PV generation. 2022 IEEE Power & Energy Society General Meeting (PESGM). https://doi.org/10.1109/pesgm48719.2022.9916812