Abstract[edit | edit source]
Background[edit | edit source]
In 1978 a group of students with the support of faculty and community members, renovated a dilapidated house on our university's campus catalyzing an experiment that continues to this day. The Campus Center for Appropriate Technology is a program at Cal Poly Humboldt dedicated to providing hands-on experiential learning opportunities in appropriate technology for both students and community members.
Aware of the increased need for shelter in time of population growth, CCAT has worked to diligently to promote the use of alternative building methods and materials through their uses in past projects and workshops.
In the spring of 2009, CCAT intends to reconstruct their strawbale shed that was leveled as a part of Humboldt State's construction of its Behavioral and Social Science building. As a part of the structure's development, the CCAT staff has sought out Professor Lonny Grafman for a materials analysis. As student in Instructor Grafman's Engr308 Technology and the Environment, the materials analysis was assigned to Jaclyn Colloton, Daniel Hernandez, Aubrey Hogeman and Robert Steffes as a course project. With the help of scientific literature and professional consultation our group has sought out the answer the question of what materials: Clay or lime, would be most feasible as a plaster finish when calculating a materials durability, accessibility, efficiency and environmental and monetary cost.
Problem statement[edit | edit source]
Our group will use Excel to create a dynamic spreadsheet that will determine for the Campus Center for Sustainable Technology (CCAT) which of the following materials would be most appropriate as an exterior plaster finish for the strawbale structure that they will be reconstructing; lime or clay.
The determination of the most appropriate material will be based on emissions of carbon dioxide, volatile organic compounds and nitrous oxide for production and transportation of each material, monetary cost, quantity of each material needed and the amount of water required.
Instructions[edit | edit source]
Link to our Spreadsheet Analysis: Media:Lime Vs Clayspreadsheetanalysis Final.xls
Instructions for using the Lime vs Clay Spreadsheet Analysis:
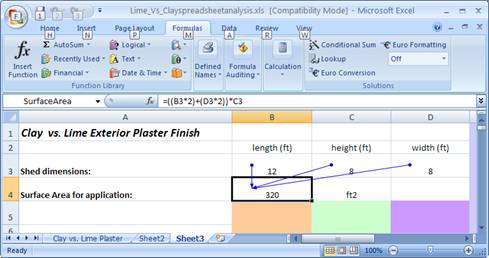
- ) The first variable needed is the area needed to be covered by the plaster/finish, or the surface area of the structure to be finished. This is accomplished by inputting the dimensions of the building in feet, assuming that the area needed to be covered is only the exterior.
Note: For interior + exterior applications, multiply the total surface area by a factor of two.
- ) The next variable to decide is mileage from distributor to your location. This can be found using www.mapquest.com.
- ) Check all included assumptions and change cell values to reflect your specific situation. (i.e. price of materials per bag) Changing the value in the cell to the left of the assumption will automatically affect the rest of the spreadsheet.
- ) Pay special attention to the Total Cost and Net CO2 values, trace irregular values back to the source cell to further your analysis.
Justifications[edit | edit source]
Justifications are located within the spreadsheet.
Results[edit | edit source]
Graph 1.1
Graph 1.2
Graph 1.3
Graph 1.4
Graph 1.5
Media:Lime Vs Clayspreadsheetanalysis Final.xls
Excel Spreadsheet Analysis
Conclusions[edit | edit source]
COST
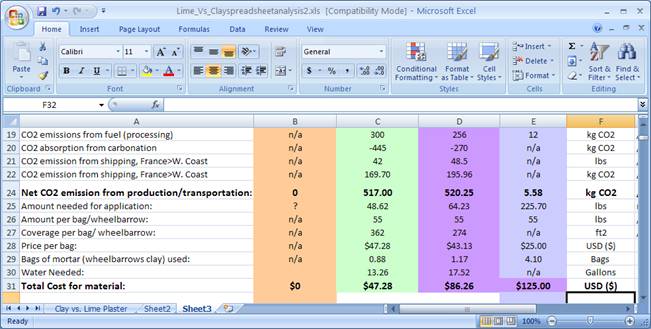
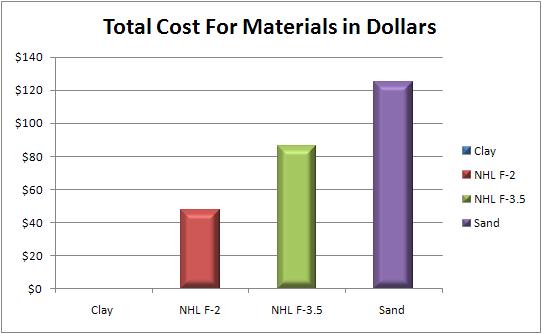
Based on our results, the most costly material is the sand. Graph 1.1 shows that the total price for this material is $125 for the surface coverage of 320 ft^2, compared to the prices of NHL F-2 ($47.28),NHL F-3.5 ($86.26)and clay, which is free. This material will be added to the lime.
CO2 EMISSIONS
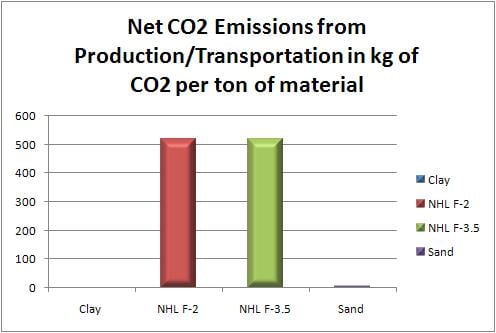
The graph 1.3 shows the net CO2 emissions for the total production and transportation of each material. This graph shows that NHL F-3.5 produces the most CO2 during total production and transportation to Humboldt County stores, producing 520.25 kg of CO2 per a ton of material. This is in comparison to NHL F-2, which produces 517 kg of CO2 per a ton of material, and Sand which produces a mere 5.58 kg of CO2 per a ton of material (Graph 1.3). Clay continues to be the lowest with 0 kg of CO2 per a ton of material assuming CCAT uses it's own clay.
EMBEDDED ENERGY
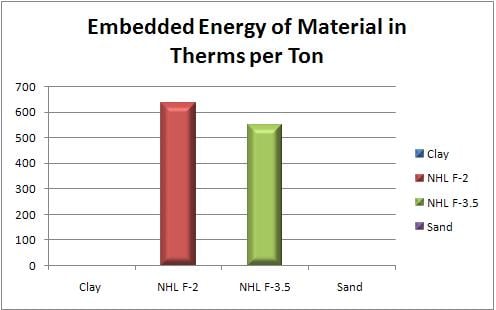
Graph 1.2 shows the total embedded energy in each material. Again clay continues to be the lowest material, accounting only for energy required for manual labor in application. The graph also shows that the material requiring the most embedded energy is NHL F-3.5 with 634 therms per a ton of material. According to the graph, NHL F-2 required 550 therms per a ton of material and Sand required a mere.04 therms per a ton of material.
SO2,VOC,NOX EMISSIONS
Total SO2 emissions from trucking distribution from Petaluma to Humboldt County for each material were as follows: Sand-12.29 grams; NHF3.5-245.43 grams; NHF2-245.43 grams; and clay- 0 grams. Also included in the trucking emissions are VOC and Nox emissions. VOC emissions for each material are as follows: NHLF2 -15700 grams; NHLF3.5- 15700; Sand- 786 grams; and clay 0 grams. Nox emissions were all zero grams. (All shown in excel sheet)
TOTAL MATERIAL
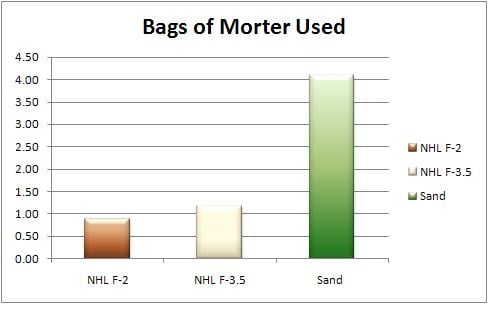
The total bags of mortar used is displayed in graph 1.4. Sand is displayed on the ration of sand and lime. For NHL-F 2, one bag of mortar would be required, rounding.88 up to 1. For NHL-F 3.5, Two bags of mortar would be required for the total surface area, rounding 1.17 up to 2.(Rounding up is done to find the total number of whole bags needed, assuming you can't buy part of a bag.) The total sand needed for the sand to lime ratio is 5 bags, again rounding up from 4.10. Calculations are shown in excel spreadsheet and graph 1.4 shows the data.
WATER REQUIREMENTS
Results also showed the required water, found only for both lime options, are shown in graph 1.5. NHL F-2 required 13.26 gallons of water total, while NHL F-3.5 required 17.52 gallons of water total.
Discussion and next steps[edit | edit source]
COST
The results and conclusions show that the most expensive material for purchase during the building of the CCAT shed finish is the sand. However, the sand only needs to be used if choosing a lime plaster for the finish. Of the two lime plaster options, NHL F-2 and NHL F-3.5, the most expensive to use would be the NHL F-3.5 providing the cost per a bag is slightly higher and the amount of bags needed is also higher. Therefore, the best option for a lime plaster would be NHL F-2 based on pricing. It also should be noted that when using a lime plaster, the cost of the sand to add in also should be factored in. For example, the cost of sand, $125, should be factored in to both lime options. Bringing the total of NHL F-2 to $172.28 and the total price of NHL F-3.5 to $211.26. However, the cheapest of the options is by far the clay, costing nothing at all, assuming that the clay is extracted from the on site location at CCAT. This option greatly reduces the cost for the entire process, although there are several setbacks to the clay option to be discussed further.
CO2 EMISSIONS
As pointed out in the conclusions, the environmental impact of carbon dioxide released from the production and transportation of the lime is much greater than the clay and sand materials. The highest CO2 emissions come from the production and transportation of NHL F-3.5 with NHL F-2 a close second. These figures take into account the amount of CO2 reabsorbed through the use of lime as well. The amounts of CO2 in the clay production is zero due to the on site extraction used by CCAT, however this could change if bought as opposed to self extracted. The spreadsheet has been adapted to include the figures if clay was bought, however for this case we did not use it due to the special circumstances. The information can easily be entered to reflect the clay if it were to be bought. The CO2 released by the sand extraction and transportation is very minimal due to the nearby extraction sites, reducing a decrease in travel. This also could be adapted to consider different mileage for the transportation within the spreadsheet.
EMBEDDED ENERGY
Considering that the CCAT only has to provide labor for the use of a clay finish, the amount of embedded energy greatly reduces. The figure would be based on how many people and how many hours each person worked. The most energy is consumed by NHL F-3.5, again making it the highest among the three options. NHL F-2 is also quite high, however, still lower than the second lime option. Sand requires little energy and provides a much lower energy requirement to receive, making the price almost justified.
SO2,VOC,NOX EMISSIONS
The various other emissions created from trucking and shipping materials is also reported in the conclusions and results sections. These also could vary depending on the site to which the material is being transported to and the amount of miles driven between point A and point B. For example if the lime mortar were trucked to Sand Diego from Petaluma as opposed to Eureka, the figures would change. These can all be re-entered in the spreadsheet for easy answering. However, for the proposed transportation from Petaluma to Eureka, the emissions of SO2, VOC, and NOX are the same for both limes, seeing as how they come from the same company. Sand continues to be lower due to the shorter travel distance and clay continues to be zero due to the on site extraction.
TOTAL MATERIAL
The total bags for such a project could also vary, depending on the size of the building. However, for this particular shed, assumed to be about 320 ft^2, the least amount of material needed is NHL F-2 with only one bag. As discussed in the conclusions, the calculations should be rounded to the nearest bag, assuming that you can not buy a quarter of a bag. The same is true with NHL F-3.5 and Sand. The sand continues to be the highest amount considering the ratio of the materials to make the actual lime plaster. Entering new dimensions for the size of the shed should automatically change all calculations to suit specific needs of specific individuals. This again, can be done using the excel spreadsheet.
WATER REQUIREMENTS
Using the Lime Plaster ratio requires the amount of water be taken into consideration. Again NHL F-3.5 continues to be the highest in material consumtion, requiring more gallons of water, considering it needs more bags to be completed. However, if one were to use a rainwater catchment system, the amount of water needed could be more easily attained for the project at hand. Keep in mind that water may need to be added to the clay mixture depending on the consistency of the extracted clay.
FINAL CONCLUSIONS
Although clay has the environmental benefits that CCAT is looking for, fewest emissions, lower cost and less materials, we would recommend that lime plaster be used for the strawbale shed. The moisture rich environment of Humboldt County is not the ideal bioregion for clay plaster and would greatly reduce the longevity and durability. Lime plaster is more durable in wet climates, like Arcata.
Safety concerns must be taken into consideration. See the spreadsheet for safety concerns when using and working with lime plaster.
NEXT STEPS
This spreadsheet can be expanded in two directions that we feel would be the most beneficial. First, the spreadsheet could include combinations of clay and lime plasters in multiple ratios of clay to lime. This would give users the opportunity to have the benefits of both plasters while negating as many pitfalls as possible.
The second way that we would expand the spreadsheet is to somehow include a bioregion analysis. For users to be able to see how each plaster would measure up in a specific bioregion would be beneficial and allow for them to make more educated decisions about the materials.
References[edit | edit source]
- Safety Regulations for Lime - http://web.archive.org/web/20190426232404/https://www.lime.org/FactSafety12403.pdf
- Lime Plaster Recipes - http://oikos.com/library/naturalbuilding/lime.html
- Guelberth, Cedar Rose. Natural Plaster Book: Earth, Lime, and Gypsum Plasters for Natural Homes.
- Gabriola Island, BC, CAN: New Society Publishers, Limited, 2003. p 68.
- http://site.ebrary.com/lib/hsulib/Doc?id=10087017&ppg=89
- Copyright © 2003. New Society Publishers, Limited.
- Hale, John; Heninemeier, Jan; Lancaster, Lynne; Lindroos, Alf; Ringbom, Asa. Dating Ancient Mortar
- American Scientist 91 no2 130-7 Mr/Ap 2003
- How Lime is Manufactured - http://cavemanchemistry.com/oldcave/projects/lime/
- Interview
- PennElys Goodshield, Director of the Sustainable Nations Development Project
- Interview
- Kristen Jenson Sullivan, Professor of Environmental Education, De Anza Community College
- Interview Wednesday, Nov. 5th, 2008
- Jess Huyghebuert, CCAT
- F. Collet,, L. Serres, J. Miriel and M. Bart Study of thermal behaviour of clay wall facing south.
- Building and Environment Volume 41, Issue 3, March 2006, Pages 307-315
- J-orge Pineda-Piñóna,,, J.T. Vega-Durána, A. Manzano-Ramírezb, J.F. Pérez-Roblesb, H Balmori-Ramírezc and M.A. Hernández-Landaverdeb; Enhancement of mechanical and hydrophobic properties of Adobes for Building Industry by the addition of polymeric agents.
- Building and Environment 42 (2007) 877-883
- Moisture Properties of Plaster and Stucco for Strawbale Buildings
- John Straube - Report for CMHC, Ottawa, 2000 - ecobuildnetwork.org
- Callahan, Tim; Snell, Clark. Building Green: A Complete How-To Guide to Alternative Building Methods Earth Plaster * Straw Bale * Cordwood * Cob * Living Roofs
- Lark Books (December 15, 2005)
- Kennedy, Joseph F; Smith, Michael; Wanek, Catherine. The Art of Natural Building
- New Society Publishers; 1 edition (February 2002)
