This page includes macros that are the result of a research project in partnership between Engr308 Technology and the Environment, The Sustainability Office, and Dining Services at Humboldt State University during Fall 2016.
The objective of this project is to analyze and compare the effects of the HSU policy and pricing regarding mason jars and disposables in terms of its monetary costs, carbon dioxide emissions, and embedded energy. A secondary goal is to create a recommendation that would improve the overall functionality of the policy. Another goal was to create compelling comparisons for consumers.
The full analysis is at HSU mason jar analysis.
Images


The following images were created by students in Engineering 308, Technology and the Environment, using the calculations from HSU mason jar analysis. These values include many assumptions that can be checked in the spreadsheets below, as well as the results from the mason jar analysis spreadsheet. The mason jar analysis spreadsheet includes the embedded energy and CO2 for the mason jars, plastic cups, and paper cups used at Humboldt State University (HSU) in 2016. The embedded energy and CO2 includes manufacturing, shipping to HSU from the manufacturer, and disposal from HSU. These spreadsheets are available for analysis and adaptation at other universities, institutions and communities.
Gallery
Below is the gallery of the macros created:
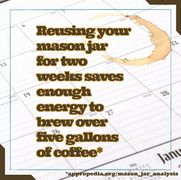
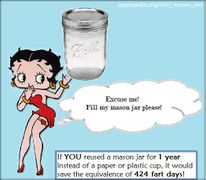
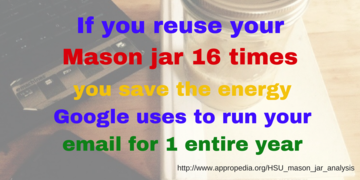
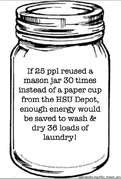
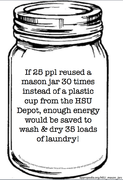
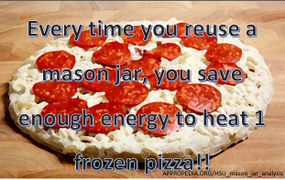
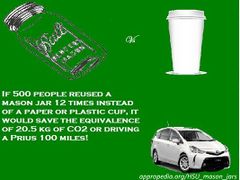
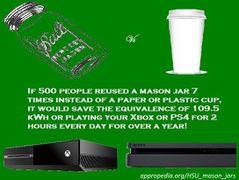
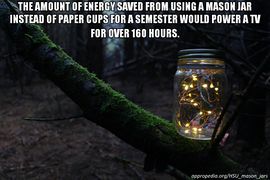
- Energy Savings from Reusing Mason Jars at Humboldt State University
-

-

-
-
-
-

-

-
-
-

-
-

-
-
-

-


Spreadsheets

The spreadsheets for each of the comparisons can be found here. Each of the files follows the same naming convention as the images above. These spreadsheets are available for transparent analysis and adaptation by others. The spreadsheets were made by students and are not vouched for by HSU or any of its employees.
Caveats
These spreadsheet comparisons were made with a gas mileage number that was slightly too large for semi trucks. Specifically, the comparison spreadsheet used an average gas mileage for shipping trucks of 9.2 km/gal. The correct value is closer to 14.8 km/gal, greatly depending on terrain. [1] This change has negligible impact on the comparison macros. The total impacts on the base values are shown in the table below:
| Mason Jar | Paper Cup | Plastic Cup | |
|---|---|---|---|
| Previous Embedded Energy (kWh/unit) | 1.81 | 0.262 | 0.273 |
| Updated Embedded Energy (kWh/unit) | 1.69 | 0.261 | 0.270 |
| Previous Carbon Dioxide (kg/unit) | 0.509 | 0.052 | 0.035 |
| Uodated Carbon Dioxide (kg/unit) | 0.469 | 0.052 | 0.034 |
Press
- https://www.facebook.com/kiem3monica/videos/866554316818361/
- http://now.humboldt.edu/news/students-probe-energy-savings-in-coffee-cups-mason-jars/
- http://khsu.org/post/campus-connections-mason-jarsyes-theyre-better#stream/0
Notes
- ↑ From "TABLE 28. Fuel Efficiency of Class 8 Trucks by Vehicle Weight Range on Flat Terrain at 65 mph" - http://cta.ornl.gov/vtmarketreport/pdf/chapter3_heavy_trucks.pdf