
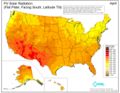
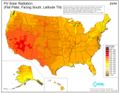
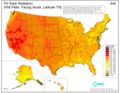
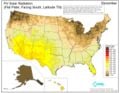
Solar Radiation Maps

These maps provide monthly average daily total solar resource information on grid cells of approximately 40 km by 40 km in size. The insolation values represent the resource available to a flat plate collector, such as a photovoltaic panel, oriented due south at an angle from horizontal equal to the latitude of the collector location. This is typical practice for PV system installation, although other orientations are also used.
These maps were developed from the Climatological Solar Radiation (CSR) Model. The U.S. Department of Energy's National Renewable Energy Laboratory developed the CSR model. Specific information about this model can be found in Maxwell, George, and Wilcox (1998) and George and Maxwell (1999). This model uses information on cloud cover, atmospheric water vapor and trace gases, and the amount of aerosols in the atmosphere, to calculate the monthly average daily total insolation (sun and sky) falling on a horizontal surface. The cloud cover data used as input to the CSR model are an 8-year histogram (1985 - 1992) of monthly average cloud fraction provided for grid cells of approximately 40 km x 40 km in size. Thus, the spatial resolution of the CSR model output is defined by this database. The data were obtained from the National Climatic Data Center in Asheville, North Carolina, and were developed from the U.S. Air Force Real Time Nephanalysis (RTNEPH) program. Atmospheric water vapor, trace gases, and aerosols are derived from a variety of sources, as summarized in the references. The procedures for converting the modeled global horizontal insolation into the insolation received by a flat plate collector at latitude tilt are described in Marion and Wilcox (1994).
Where possible, existing ground measurement stations are used to validate the model. Nevertheless, there is uncertainty associated with the meteorological input to the model, since some of the input parameters are not available at a 40 km resolution. As a result, it is believed that the modeled values are accurate to approximately 10% of a true measured value within the grid cell. Due to terrain effects and other microclimate influences, the local cloud cover can vary significantly even within a single grid cell. Furthermore, the uncertainty of the modeled estimates increases with distance from reliable measurement sources and with the complexity of the terrain.
Solar Resources for Flat Plate Collectors
[edit | edit source]-
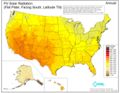 2004 Annual
 -
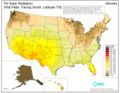 January 2004
 -
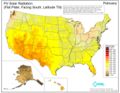 February 2004
 -
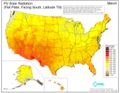 March 2004
 -
 April 2004
 -
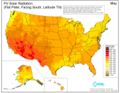 May 2004
 -
 June 2004
 -
 July 2004
 -
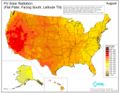 August 2004
 -
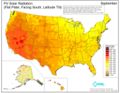 September 2004
 -
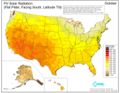 October 2004
 -
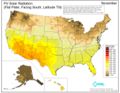 November 2004
 -
 December 2004


References
[edit | edit source]- George, R, and E. Maxwell, 1999: "High-Resolution Maps of Solar Collector Performance Using A Climatological Solar Radiation Model," Proceedings of the 1999 Annual Conference, American Solar Energy Society, Portland, ME.
- Maxwell, E, R. George, and S. Wilcox, "A Climatological Solar Radiation Model," Proceedings of the 1998 Annual Conference, American Solar Energy Society, Albuquerque NM.
- Marion, William and Stephen Wilcox, 1994: "Solar Radiation Data Manual for Flat-plate and Concentrating Collectors." NREL/TP-463-5607, National Renewable Energy Laboratory, 1617 Cole Boulevard, Golden, CO 80401.
| Authors | |
|---|---|
| License | CC-BY-SA-3.0 |
| Cite as | "Solar Radiation Maps". Appropedia. 2007–2026. Retrieved July 14, 2026. |