Methods for optimizing the dispatch strategy for a-Si:H-based PVT[edit | edit source]
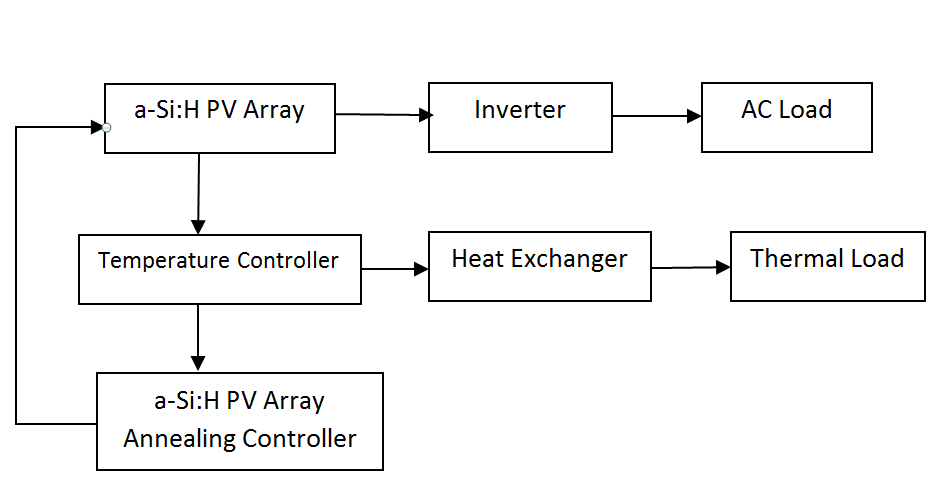
The schematic diagram of PVT system. The a-Si:H PV is connected to an inverter that powers the AC load and the heat generated by the PVT is transferred to thermal load by a heat exchanger. A temperature controller is used to control both this heat flow and the regular thermal annealing.
The total energy generated by the PV of power, P, for an year:
Pn is the power produced in the nth hour and t is time, which is 1 hour is this case.
The maximum power, Pmax(T), at a temperature T is
S and Sref are the irradiance and reference irradiance level respectively, Pmax(ref) is the maximum power at a reference temperature Tref which is 25 °C
An exponential term for the reversal of degradation of power with time is proposed in the expression to account for the thermal annealing,
k is a dimensionless constant and A is a rate constant obtained by curve fitting .
The degradation of a-Si:H PV was approximated as:
PDSS(ref) is the stabilized power at degraded steady-state at reference temperature, S is the solar irradiance, which was obtained
from Renewable Resource Data Center, kDSS(T) is a constant dependent on temperature and μ is the rate constant determined experimentally
During annealing, power can be almost approximated by
On the basis of these equations, the experimental results from Pathak et al. (Pathak, 2012) were being modeled . Six dispatch strategies were
tested as outlined in Table I.
Table I - Dispatch of spike annealing
For all the above cases, the model was simulated at outdoor conditions and for various geographic locations for a year (2008) in India to better understand
real-world significance of this type of PVT system under different dispatch strategy.
Table II - Summary of climate for cities chosen for simulation
Average solar irradiance on hourly basis averaged over an year and for 4 cities (New Delhi, Indore, Ahmedabad, Bangalore) was also calculated to determine the
best time for annealing
Si is the average solar irradiance for ith hour of four cities (averaged yearly), and Si,n,city is the solar irradiance for ith hour and nth day for an year
for a city mentioned above.
parameters[edit | edit source]
Pmax(t) = 3.80625
PDSS(ref)= 3.80625
Pmax(ref)= 3.80625
γ= -0.002
K=0.3127
KDSS(ref)= 0.4269
μ=0.07332
A=-33.9140
δ = +.063
Sref = 1000 W/m2
kDSS(T) = 0.4269
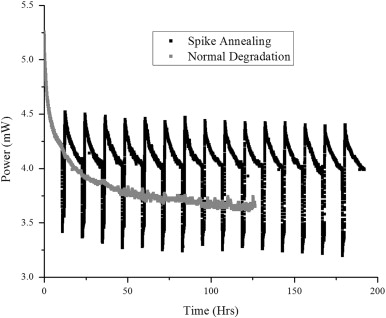
The data from Effects on amorphous silicon photovoltaic performance from high-temperature annealing pulses in photovoltaic thermal hybrid devices were used for getting the power vs time under different spike annealing, and with the help of this data, degradation rate and parameters were calculated as mentioned above, and with the above mentioned parameters and equations the overall performance of the system can be monitored and analyzed.
Procedure: Copy all the matlab files to a folder and run dispatch_strategy_simulations.m Matlab files
After running the simulation all the results can be found out with the below mentioned symbolic name for corresponding output matrix. Graph can be generated on Excel by coping result matrix generated by matlab.
Case I:
pmax_50_caseI_shm
pmax_50_caseI_nd
pmax_50_caseI_ind
pmax_50_caseI_ahm
pmax_50_caseI_bang
mpmax_50_caseI_shm
mpmax_50_caseI_nd
mpmax_50_caseI_ind
mpmax_50_caseI_ahm
mpmax_50_caseI_bang
Following results are at 90 degree celcious
Case II:
pmax_90_caseII_shm
pmax_90_caseII_nd
pmax_90_caseII_ind
pmax_90_caseII_ahm
pmax_90_caseII_bang
mpmax_90_caseII_shm
mpmax_90_caseII_nd
mpmax_90_caseII_ind
mpmax_90_caseII_ahm
mpmax_90_caseII_bang
Case III:
pmax_case_III_shm
pmax_case_III_nd
pmax_case_III_ind
pmax_case_III_ahm
pmax_case_III_bang
nmax_case_III_shm
nmax_case_III_nd
nmax_case_III_ind
nmax_case_III_ahm
nmax_case_III_bang
Case IV:
pmax_case_IV_shm
pmax_case_IV_nd
pmax_case_IV_ind
pmax_case_IV_ahm
pmax_case_IV_bang
nmax_case_IV_shm
nmax_case_IV_nd
nmax_case_IV_ind
nmax_case_IV_ahm
nmax_case_IV_bang
Case V:
pmax_case_V_shm
pmax_case_V_nd
pmax_case_V_ind
pmax_case_V_ahm
pmax_case_V_bang
nmax_case_V_shm
nmax_case_V_nd
nmax_case_V_ind
nmax_case_V_ahm
nmax_case_V_bang
Case VI:
pmax_case_VI_shm
pmax_case_VI_nd
pmax_case_VI_ind
pmax_case_VI_ahm
pmax_case_VI_bang
nmax_case_VI_shm
nmax_case_VI_nd
nmax_case_VI_ind
nmax_case_VI_ahm
nmax_case_VI_bang
Annual data for all cities
annual_data_shm
annual_data_nd
annual_data_ind
annual_data_ahm
annual_data_bang
Percentage increment for all cities with respect to case I
percent_data_shm
percent_data_nd
percent_data_ind
percent_data_ahm
percent_data_bang


