Project Purpose
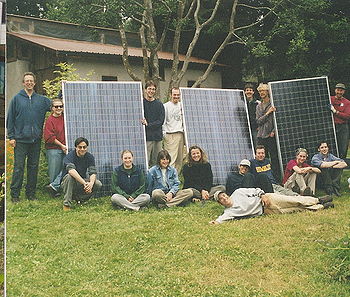
This page describes the history of the photovoltaic system(PV) installed on the roof of CCAT (Campus Center for Appropriate Technology) at Humboldt State University (HSU). The PV system harnesses a renewable source of energy to generate electricity for the CCAT house. This project is sponsored by the Humboldt Energy Independence Fund (HEIF), an entirely student funded organization. The Campus Center for Appropriate Technology is a student run organization focusing on renewable, environmental and self-sustainable technology. CCAT is a live-in demonstration house and educational center on HSU campus.[1]
About CCAT
CCAT is a student-initiated, student-run, and student funded demonstration home at Humboldt State University, dedicated to resource and energy-efficient living. The Center was started in 1978. Today, CCAT is a thriving household and educational center that has been integrated into the University’s curriculum. People contact CCAT from around the world, seeking information on sustainable living techniques. Locally, CCAT is a demonstration home showing appropriate technology in action. It provides tours, workshops, and experiential learning opportunities to the local community. CCAT’s solar and other systems have been featured in HP32 and HP43.
Background
In May of 1991, CCAT installed a PV solar system. This system ran off the grid for 10 years generating power for the CCAT house along with a wind turbine and backup bio diesel generator. In 2001, a new grid tied PV system of 8 ASE-300-DGF/17 modules of 300 Watts each. This system ran for only a few years before the CCAT house was moved several hundred feet to the southwest to make room for the BSS building at HSU in 2005. It has since been reconnected in 2008 and is still grid tied.
PV Definition
Photovoltaics is the direct conversion of light into electricity at the atomic level. Some materials exhibit a property known as the photoelectric effect that causes them to absorb photons of light and release electrons. When these free electrons are captured, an electric current results that can be used as electricity.
The photoelectric effect was first noted by a French physicist, Edmund Bequerel, in 1839, who found that certain materials would produce small amounts of electric current when exposed to light. In 1905, Albert Einstein described the nature of light and the photoelectric effect on which photovoltaic technology is based. He later won a Nobel prize in physics for this work. The first photovoltaic module was built by Bell Laboratories in 1954. It was billed as a solar battery and was mostly just a curiosity as it was too expensive to gain widespread use. In the 1960s, the space industry began to make the first serious use of the technology to provide power aboard spacecraft. Through the space programs, the technology advanced, its reliability was established, and the cost began to decline. During the energy crisis in the 1970s, photovoltaic technology gained recognition as a source of power for non-space applications.
Solar cells are made of the same kinds of semiconductor materials, such as silicon, used in the microelectronics industry. For solar cells, a thin semiconductor wafer is specially treated to form an electric field, positive on one side and negative on the other. When light energy strikes the solar cell, electrons are knocked loose from the atoms in the semiconductor material. If electrical conductors are attached to the positive and negative sides, forming an electrical circuit, the electrons can be captured in the form of an electric current -- that is, electricity. This electricity can then be used to power a load, such as a light or a tool.
A number of solar cells electrically connected to each other and mounted in a support structure or frame is called a photovoltaic module. Modules are designed to supply electricity at a certain voltage, such as a common 12 volts system. The current produced is directly dependent on how much light strikes the module.
Multiple modules can be wired together to form an array. In general, the larger the area of a module or array, the more electricity that will be produced. Photovoltaic modules and arrays produce direct-current (dc) electricity. They can be connected in both series and parallel electrical arrangements to produce any required voltage and current combination.
Today's most common PV devices use a single junction, or interface, to create an electric field within a semiconductor such as a PV cell. In a single-junction PV cell, only photons whose energy is equal to or greater than the band gap of the cell material can free an electron for an electric circuit. In other words, the photovoltaic response of single-junction cells is limited to the portion of the sun's spectrum whose energy is above the band gap of the absorbing material, and lower-energy photons are not used. [2]
History
Originally conceived by Jim Zoellick, the CCAT PV system has been designed as a working demonstration of solar energy production for the many visitors to the CCAT house. Electrical energy use and PV production are documented on a dry erase board....(missing page)
The Old Stand-Alone System
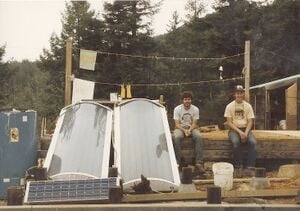
The old stand-alone PV system at CCAT consisted of 22 Solec International photovoltaic panels, a Whisper wind turbine, and a backup generator. The PVs were donated in the 1980s from the Flat Plate Array Project at the Jet Propulsion Lab. The output from the 22 panel array was about 700 watts peak on a sunny summer day. The Whisper H500 wind turbine, standing 43 feet (13 m) tall and using a World Power control box, generated very little, due to the site’s poor wind energy potential. Part of the problem was that the surrounding trees had grown considerably since the original wind generator was first installed on that tower in 1984. Energy generated during the day was stored in a 24 volt battery bank consisting of twelve, Trojan L-16 batteries. A Trace C40 charge controller regulated the battery voltage during charging. Twelve volt DC loads were supplied via a Vanner battery equalizer, and AC loads were supplied using a Trace SW4024 inverter. A biodiesel engine generator was used to charge the battery bank as needed. The solar-electric modules from the old system are now being used for learning opportunities at CCAT. Students in a variety of classes and workshops will have a chance to wire up the panels and test their output.
The New Grid-Connected System
Design of the new system was centered around a generous donation of eight, large area (4 x 6 foot; 1.2 x 1.8 m) modules from ASE Americas, Inc. The modules, model number ASE-300-DGF/17, are each rated at 300 W at standard test conditions (STC). STC are an irradiance of 1,000 watts per square meter, and a cell temperature of 25°C (77°F). These are 12 volt nominal modules, with a rated maximum power point voltage of 17.2 V. Four of these modules wired in series create a roughly 1 KW, 48 V building block for a grid-connected system (derated by 12 percent from STC rating to better represent PV output under normal operating conditions at our location). CCAT's team planned to use two series strings of four modules each, giving us a 48 V, 2 KW system. The first and biggest design decision was to choose an inverter for the system. CCAT already owned a Trace SW4024 inverter that had been used in the stand-alone PV system, so obviously they considered this as a prime candidate. It is rated for grid-tied applications, and has more than enough capacity to handle the total rated array output of 2,400 W. However, most Trace SW series inverters require at least a small battery bank. CCAT wanted to put in a system that set a good example for other potential grid connected PV adopters. Unless you have a serious need for backup power (you really have some critical loads), it doesn’t make any sense to install a gridconnected system with battery backup. Batteries complicate PV systems. They add significantly to system cost. They need to be maintained regularly and replaced periodically. And they add significant inefficiencies to the system. In most places, the grid is not down very often or for very long, so batteries add no benefit most of the time. After they spoke with an engineer at Trace, and studied the capabilities of the Trace SW4024, including the adjustable software settings such as float voltage, sell mode voltage, and grid usage timer, they decided against this option. This inverter is simply not optimized for PV systems installed in grid-connected applications. When the PVs are not charging, this inverter constantly float charges the batteries with electricity from the grid. At best, with a minimum sized battery bank capacity of 100 AH (per Trace specifications), they expected to lose at least a few hundred watt-hours per day and perhaps as much as 1 to 2 KWH per day due to battery charging. That was simply unacceptable to them. It represented a system efficiency loss of anywhere from 5 to 25 percent. They did consider adding a voltage-controlled relay system that would connect the inverter to the grid only when the PVs were charging, thereby minimizing any battery charging from the grid. They decided against this because it would complicate the system and make it less representative of a standard grid-connected system. In addition, the SW4024 does not offer maximum power point tracking, and would require charge controllers to provide battery overcharge protection in the event of a grid failure. The team also considered the Trace Sun Tie ST2500. This is a utility-interactive inverter that does not require any batteries. However, Trace has had some serious problems with the maximum power point tracking feature in the Sun Tie series inverters. After they talked to Trace and other experts in the field about the problem, they decided that they were not willing to take a risk with a Trace Sun Tie unit. This left only one other option for a California Energy Commission (CEC) certified utility-interactive inverter that was configured to accept 48 VDC input. This was the GC-1000 manufactured by Advanced Energy. This inverter came highly recommended from a couple of our industry contacts. It is rated at 1 KW single-phase 120 VAC output, features maximum power point tracking, and has a peak efficiency of 93 percent. One of these inverters is a good match with four, 12 volt nominal ASE Americas 300 W modules wired in series,so we chose to use two of these inverters.We contacted Advanced Energy and they generously agreed to donate two refurbished GC-1000 inverters, along with a data monitoring system for our demonstration project. Since the majority of our equipment was donated, the team did not apply for CEC buydown funds. However, they still decided to use equipment that was certified by the CEC. The Advanced Energy inverter is well accepted, and CCAT wanted their electric utility to approve the equipment without question.
New System Description
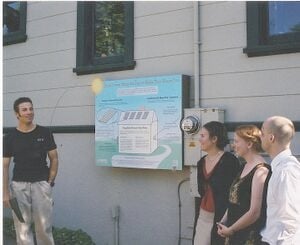
Each of the two inverters is independently connected to four PV modules wired in series. The inverters are factory-equipped with a 25 A breaker, a 30 A fuse and ground-fault protection on the DC input.They have a 15 A breaker, 15 A fuse, and surge arrestor on the AC output. The hot legs of the two inverter AC outputs are switched using a PG&E approved, 30 A, double pole disconnect switch. This is a lockable, visible disconnect switch, mounted alongside the main service panel next to PG&E’s meter, and meets PG&E’s interconnection requirements.
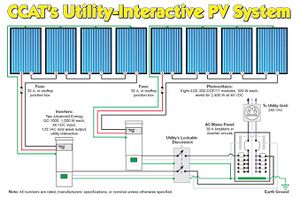
The AC output from each inverter is wired to a 30 A breaker in the main service panel. The CCAT roof is conveniently oriented due south, with a slope of 26.5 degrees from horizontal. At our Arcata latitude of 41 degrees north, the roof slope falls just within a recommended array slope of ±15 degrees of our latitude. In addition, analysis of Arcata solar insolation data (obtained from the National Solar Radiation Database) indicates that the annual amount of insolation received on a sloped surface in Arcata is nearly identical for slopes ranging from 20 to 40 degrees. With this background information, we chose to mount the PV modules parallel to the slope of the roof, using the Schott Applied Power (formerly Ascension Technology) pitched RoofJack mounting system. A junction box, also purchased from Schott Applied Power, mounts to the center RoofJack. It contains 30 A fuses, and serves as a combiner box where we terminate the array leads and start our DC wire run, enclosed in conduit, to the inverters. (See the system schematic.)
CCAT Electrical Loads
The electrical loads at CCAT vary with the seasons. In general, energy use is higher when school is in session due to an increase in activity. Loads include fluorescent lights, stereos, computers, power tools, and other miscellaneous equipment. During the summer, CCAT runs a Sun Frost refrigerator, while the other eight months of the year they use a cold box with a natural convection cycle to keep food cold. A variety of pedal-powered appliances, such as a TV and a blender, also help to conserve electricity. As CCAT continues to expand and demonstrate alternatives for living lightly, new energy demands sometimes arise. For example, CCAT recently joined efforts with the campus recycling program to greatly reduce food waste on the HSU campus. The project involves use of an electrically driven shredder that prepares the food waste to enter an industrial-sized vermicompost (worm) bin capable of handling up to 150 pounds (68 kg) a day. The bin itself also requires electricity to run a motorized unit that forces the finished compost out of the bin for collection. Their best estimate of our itemized electrical use is in the load table. CCAT's actual usage between October 2001 and April 2002 averaged 1.9 KWH per day, which agrees closely with their estimate. (*Update with current usage)
Net Metering Rate Options
After adjusting for an expected array operating temperature of 122°F (50°C) and an average inverter efficiency of 84 percent, the new grid-connected PV system is expected to provide approximately 1.8 KW of peak AC power. Given their annual average of about four peak sun hours per day in Arcata, they expect an average daily energy output of 7.2 KWH. This is well beyond CCAT’s current energy needs of 1.9 KWH per day, so the system should produce a significant excess of solar electricity. The PV system is definitely oversized. It would not be a cost effective design for the typical homeowner because PG&E won’t pay for any excess electrical generation. If you’re running a net metered system in California, the best you can do is net your energy cost to zero on an annual basis and pay the utility’s minimum monthly charge. In PG&E territory, this amounts to US$5 each month. Most of CCAT's equipment was donated, so it did not cost them any extra for the excess clean solar electricity they feed into the grid. This results in a modest benefit to the environment and, inadvertently, to PG&E’s pocketbook. They’re looking forward to the day when the utilities are required to pay a premium rate for excess electricity generated using renewable resources. They could sell this electricity through their green power programs. CCAT's rate options for net metering included the standard residential rate, or the residential time-of-use (TOU) rate. CCAT considered both of these options. The TOU rate would have required installation of a TOU meter at a cost of US$277. Because they generate an excess of solar electricity, the TOU rate will not benefit them. It’s a different situation for residential PG&E customers whose electricity usage is primarily during the evening and weekend periods (people who work during the daytime and minimize their phantom loads). The TOU rate can allow them to install a smaller PV system and still reduce their electricity bill to the minimum US$5 service charge. This is because the TOU rate puts a higher value on electricity used or generated during the summer peak hours. The optimal way to minimize your bill is to have electricity costs exactly cancel out electricity “revenues” on an annual basis. The summer peak period for TOU customers is May 1 through October 31 from noon to 6 PM, Monday through Friday. Peak usage during this period is driven by the high cooling load in much of California. During this period, the TOU rate is about US32¢ per KWH. During the winter peak period, the TOU rate is about US12¢ per KWH, and during the off-peak periods it is about US9¢ per KWH. So, if most of your energy usage is during the off-peak periods and a substantial amount of your PV electricity is generated during the peak periods, you can significantly decrease the optimal size of your PV system (and the associated capital costs). For example, they have estimated that a PV system facing due south at a slope of 41 degrees in Arcata will generate approximately 27 percent of its annual energy production during the summer peak period, and another 17 percent during the winter peak period. Assuming you are on the TOU rate and use all of your electricity during the off-peak periods, this would allow you to decrease the size of your PV array by 41 percent. With an average daily electrical usage of 10 KWH per day on the standard rate, you would need about a 2.9 KW system (rated at STC) to net your electricity cost to zero and thereby lower your bill to the US$5 minimum per month. On the TOU rate, you could decrease your system size to 1.7 KW, and still limit your bill to US$5 per month.
Module Testing
Because CCAT is part of a university, they have an interest in testing and evaluating systems. They made sure not to miss this opportunity with their new system. CCAT measured individual current versus voltage curves (I-V curves) for each of the eight ASE modules prior to installation. Although the donated ASE modules were reportedly manufacturer’s "leftovers" due to cosmetic defects, they performed remarkably well. Their measurements showed that module output was within 1 percent of the manufacturer’s measurements supplied with the modules, and within 2 percent of their nameplate rating. ASE uses a plus or minus 4 percent tolerance for rating the output of their PVs. Most other PV manufacturers use a plus or minus 10 percent tolerance rating. CCAT thinks that ASE’s truth in advertising is laudable. ASE sets a high standard for rating the output of their PVs. CCAT hopes that the other module manufacturers will follow suit. The I-V curves were generated in ambient sunlight in Arcata, California near midday in June 2001, using an electronic DC load device. As the load was varied, the module traversed its operating curve from short circuit current to open circuit voltage. During the tests, CCAT also measured the radiation incident in the plane of the module as well as the module operating temperature. These measurements were then used to standardize the performance curves to STC. (See the module I-V curve.)
System Installation
For a number of reasons, CCAT took a team approach to system installation. The CCAT house is an old structure, and the AC electrical wiring needed some work to bring it up to code before they could reconnect to PG&E. CCAT had Peter Brant, a local electrical contractor, perform this work. While he was at it, the team had him install the AC disconnect for the PV system, prepare the AC panel for interconnection, and run the AC wiring from the inverter room to the AC disconnect. CCAT had Bob-O Schultze, a solar-electric contractor, run the DC wire and conduit, assist with the inverter and PV module installation, and ensure that our installation was code compliant. They installed the array mounting structure, PV modules, and inverters themselves, with help from students in a PV Design and Installation class offered through the Environmental Resources Engineering Department at HSU. The equipment we chose allowed for a rather quick and easy installation procedure.
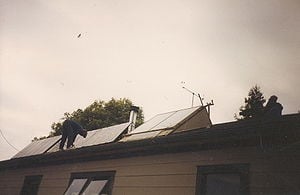
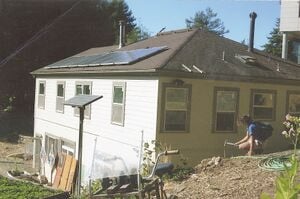
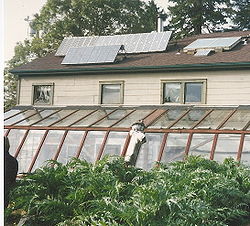
The RoofJack mounting system is designed for pitched asphalt shingle roofs like CCAT’s. It supports the modules about 3 inches (7.6 cm) above and parallel to the roof, allowing for adequate air circulation between the modules and the roof to promote module cooling. The RoofJacks came complete with self-drilling fasteners (21/4 inch, #12) and sealing washers, preapplied butyl-rubber sealing pads, and pipe nipples for wire pass-through between modules. Their eight, large area modules were installed in one continuous row. Each module is supported by four RoofJacks, one placed near each of the module’s four corners. There are two types of RoofJacks—end and interior. They used four end RoofJacks at the extremities of the array. A pair of shared interior RoofJacks support the module edges that are located next to other modules, for a total of 14 interior RoofJacks. To properly locate the RoofJacks on the roof, they built a jig with the bolt hole pattern for one set of RoofJacks. After installing the first set, CCAT simply moved the jig over and installed the next set, and so on. According to the manufacturer, securing the RoofJacks directly to the sheathing (a minimum of 5/8 inch; 16 mm thickness) is adequate, but they felt that it was prudent to add reinforcement. The team located the array on the roof so that four of the interior RoofJacks were secured directly to two rafters. To secure the remaining RoofJacks, they either scabbed 2 by 4 blocks to a rafter or added strips of plywood sheathing on the underside of the roof sheathing to provide a more secure attachment. Once the RoofJacks were installed, the modules were outfitted with their mounting bolts. Four bolts were attached to each module, two on each side near the corners. These bolts protrude about 1/2 inch (13 mm) with a sleeve. To install the modules, they simply lifted them into place and slid the four mounting bolts into slots on the RoofJacks. Wiring the array was just as easy. CCAT's system consists of two separate subarrays, each comprised of four modules wired in series and connected to an inverter. The first set of four modules in the row make up one subarray, and the second set of modules make up the second subarray.
CCAT mounted the array combiner box in the center of the row of eight modules between the two arrays. This box houses fusing for the arrays, and provides a place to terminate our array wiring before running wire to the inverters. The wiring between modules was provided by the module manufacturer, and came equipped with weatherproof connectors designed for series wiring of modules. Once the modules were in place, they simply snapped these connectors together, added their solid copper grounding wire between modules, and terminated these wires in the combiner box. CCAT wall mounted the Advanced Energy GC-1000 inverters in a room in the basement that has historically been used to house PV system equipment. The inverters came with PV string combiner boards. These were sized to handle up to six individual strings rated at 10 amps each. However, they had a single module string with a short circuit current rating of 19.1 A, so the team removed this board. It was a little tricky to figure out how to wire the inverters without it and still use the GFI protection and AC and DC circuit breakers that were provided with the units. After examining the units and speaking with the manufacturer, they found that they could wire the DC input directly to the DC breaker, bypassing the combiner board while still using the other features. AC surge arrestors were supplied with the units. Since they are not in a lightning prone area, the inverter manufacturer suggested that DC surge protection was unnecessary. In addition to donating the inverters, Advanced Energy included their AM100 Inverter Monitor. This unit monitors up to six inverters, and features an LCD display and a four-button keypad as a user interface. It logs DC current, DC voltage, AC current, AC voltage, AC power output, inverter efficiency, and cumulative AC energy output. When it collects data at 15 minute intervals, the AM100 is able to store about 30 days worth of data. The data is downloadable via a serial communication port. To access the data, Advanced Energy provides their PVMON software that runs on any DOS or Windows-based personal computer. Data files are stored in Excel compatible (.CSV), comma delimited format. A single data file is recorded for each day. The data is easy to download and access.
System Performance
The new grid-connected PV system first started generating on October 17, 2001. Of the 901 KWH total solar-electric energy generated as of April 23, 2002, 358 KWH were used on-site, and the other 543 KWH were fed back into the PG&E grid. During this period, they averaged 1.9 KWH per day of electrical energy use, while the PV system generated an average of 4.8 KWH per day.
Data for about a one-month period in mid-February to mid-March of 2002 was examined to evaluate the performance of the system. During this period, the PV system generated an average of 4.9 KWH per day. The maximum AC power output was 1,745 W, with a corresponding maximum DC input power of 2,155 W (81 percent average inverter efficiency). The inverters, with a rated peak efficiency of 93 percent, averaged 83 percent and 85 percent, respectively. About 99 percent of the time, the input voltage to the inverters was within their maximum power point tracking range of 55 to 70 VDC. Inverter efficiency varies as a function of AC power output. (See the inverter efficiency plot.) The highest points in the graph are clearly aberrations in the data. However, there are over 1,400 total data points, of which only 30 show efficiencies greater than 96 percent. In all cases, these abnormally high efficiency readings are recorded at very low power outputs (always less than 171 W). Since startup, CCAT has experienced only one minor problem—a blown fuse on the DC input to the inverter. They suspect that this was due to enhanced insolation conditions associated with cloud reflection. The team are very pleased with the performance of their new PV system and our decision to reconnect to the grid. They do realize that their reconnection to the grid threatens to make them less aware of their energy use patterns and lax in their energy efficiency efforts. So they are making a concerted effort to keep track of their usage and to maintain their efficient ways.
References
Pictures: http://www.appropedia.org/Humboldt_photovoltaic_gallery