This page looks into a comparison between the traditional fossil energy source in NYS - natural gas - and the ongoing renewable energy development (offshore wind energy for electricity generation). A life-cycle cost and greenhouse gas (GHG) analyses are attempted for both energy sources. However, due to limited data, the analyses conducted in this project did not consider a lot of factors which may influence the results. Another thing to note is that due to the difference in these power sources as regards their construction and operation, it is difficult to conduct a precise comparative analysis. Therefore, this page aims to give an overview of both power sources.
Abstract[edit | edit source]
This study aims to assess the cost benefit and sustainability of the current largest fossil fuel used in electricity generation – natural gas. The lifecycle costs were analyzed based on data gotten from the U.S. Energy Information Administration (EIA). This included the cost of extraction and expenditure specifically centered to New York State. Also, its greenhouse gas (GHG) emissions were analyzed in all phases of its life cycle. These analyses were compared to that of a renewable source of energy under production currently in NY which are the offshore wind projects to provide about 4,300 MW of energy. A sustainability study was also conducted on these projects to assess its benefits and costs in comparison to fossil fuel. The results show that while wind energy is expensive to install and maintain, it produces more energy than natural gas without the GHG emissions. It was found that while natural gas is a cheaper source of energy, the GHG emissions are 40 times larger than wind power plants. It was also found that the health, climate and power grid value of wind energy far outweigh its costs making it a good investment in the sustainable development of New York and this will drastically reduce the harmful emissions to the environment.
Introduction[edit | edit source]
The exhaustive extraction, processing and use of fossil fuel have greatly impacted our planet, causing greenhouse gas emissions that depletes our ozone layer leading to air pollution that negatively impacts our health, and other kinds of pollution – like soil and groundwater – that affects our ecosystem and kills useful organisms. To reverse the harm done to our environment on a national scale, the United States has taken steps to improve the overall health of the environment. The US is moving to more sustainable ways of operation such as the gradual phase out of coal in the generation of electricity as was reported by the EPA (EPA, 2023) and by moving gradually to more renewable sources for energy generation through the investment in greener and cleaner sources of power such as solar and wind energy. On a more local scale, New York State (NY) has also taken measures to improve the environment ecosystem such as the use of clean energy buses as means of transportation, encouraging green buildings and putting in place regulations that reduce urban runoff. In this project, we are going to be focusing on one sustainable development program undertaken by NYS which is the incorporation of a renewable source of energy. This is the offshore wind projects that are being developed (1) 60 miles east of Montauk Point, (2) 14 miles from Jones Beach State Park, and (3) 30 miles off the east coast of Long Island to offset the use of fossil fuel and has a goal of providing about 4,300 megawatts which represents half of the needed wind energy of 9,000 megawatts by 2035. This study aims to conduct a quantitative and qualitative feasibility study on this method of renewable energy production to determine the cost and environmental benefits. A comparative analysis will also be done to determine the advantages of this method over the traditional sources of energy. The aim is to determine if the wind energy projects are sustainable, environmentally and cost effective.
Background[edit | edit source]
Existing Electricity Sources in New York State[edit | edit source]
Natural gas is a cleaner cost-effective fossil fuel which has led to economic growth while acting as the bridge for decarbonization in the United States. It is also a resource that has become abundant due to technological advancement reducing the extraction cost and overall increasing the supply of the ‘clean’ fuel. This has increased the demand for natural gas, especially to heat residential and commercial buildings. However, research has concluded that without strict climate and emissions policies put in place, this electricity source will slow down decarbonization and increase emissions due to its damaging effects on the environment such as methane leakages, contamination of surroundings with waste and a negative impact on aquatic habitats due to the large amounts of water used for fracking. Also, due to the ban, the gas reserves are limited and cannot cater to NY for a long time. Therefore, something better and more efficient is needed for electricity generation and the best option is the use of renewable energy which will be studied next.
Qualitative Analysis of Renewable Sources of Electricity[edit | edit source]

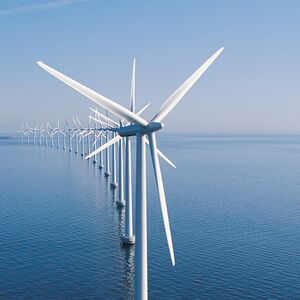
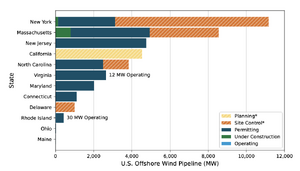
In this study, wind energy is the focus of our renewable energy resource therefore, renewable, or clean energy mentioned from here onward will refer to wind energy. According to the U.S. Wind Turbine Database (U.S. Geological Survey), there are 72,669 turbines in the contiguous United States having a total rated capacity of 138,386 MW, and out of these turbines, there are only seven installed and operating offshore turbines with a combined generating capacity of 42 MW (Dawes & Majkut, 2023) which is just about 3e-4 % of the total generating capacity of the U.S. turbines. However, there are planned offshore wind projects in various stages of development, from permitting to bidding to the construction stage. In New York State, the Research and Development Authority (NYSERDA) is working to develop an offshore wind goal of 9,000 MW by 2035 and to achieve this, they currently have five offshore wind projects in active development; Beacon Wind project (1,230 MW capacity) located east of Montauk Point is in its data collection stage, Empire Wind 1 & 2 project (816 & 1,260 MW capacity respectively) located 14 miles from Jones Beach State Park are in their manufacturing stage, Sunrise Wind (924 MW capacity) located off the east coast of Long Island is also in its manufacturing stage, and the South Fork Wind Farm (130 MW capacity) located off the east coast of Long Island is expected to be the first NY operational offshore wind farm with an expected operational start at the end of 2023 (New York State Energy Research and Development Authority (NYSERDA)). As shown in Figure 5, NY has the largest offshore wind pipeline in the U.S. and most of these projects are under active development.
Methods and Analysis[edit | edit source]
Cost Analysis[edit | edit source]
Natural Gas
According to the U.S. Energy Information Administration (EIA) report (US EIA, 2022) on natural gas production rate, it was recorded that the gross withdrawals of natural gas from wells in 2021 reached 118.7 billion cubic feet per day (Bcf/d) and the number of producing wells was just under 1 million (916,934) also in 2021. This will form the basis of our cost analysis as there is little information on the production costs in the United States. A simple calculation will put the production rate to be 129,453 cf/d in one well (ceteris paribus). A conversion factor from cu ft to Btu (US EIA, 2021) puts the daily production rate per well at 134 million Btu/d (MM Btu/d). Therefore, the annual production rate per well will be 49 billion Btu/yr. Assuming a life cycle of 20 years, the total net natural gas production at a well during its lifetime will then be 980 billion Btu, which is a considerable amount of energy. Additionally, maintenance costs over the entire life cycle of the well are estimated to be from $1M to $3.5M. For this study, we will use the average value of $2.3M. An additional $2.3M is allocated for the gathering, processing, and transport costs over the lifetime of the well (IHS Global Inc., 2015). This gives a total of approximately $11.6M for the construction and operation of a well. Therefore, the total cost per unit of energy of natural gas would be very insignificant. However, we must note that the cost estimation was due to available resources which are limited and do not thoroughly account for the total breakdown.
Offshore Wind Energy

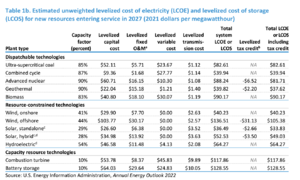
It is no secret that the cost of wind energy can be very expensive in general. A report (Institute for Energy Research ) said that “offshore wind energy is a very, very expensive electricity source”. An average-sized commercial wind turbine with a 2-3MW capacity is estimated to initially cost about $3 - $4 million (WINDUSTRY; Blewett, 2021). Any cost analysis done will be on one of New York’s wind projects – the largest wind farm, Empire Wind 2 (EW2) with a total capacity of 1260MW – discussed in the Background section which has the state permits approved and is in its construction and fabrication stage (Empire Wind). Applying the 2021 levelized cost of energy (as shown in Figure 2) to EW2 will give a total cost of $18.5 billion.
Additionally, one thing to note is the variability and intermittency of wind energy for electricity generation, which can be an issue. Therefore, it is important to have backup power that can act as a balance between the demand and supply of electricity equivalent to about 80-90% of the average wind energy output. This can be in the form of a gas plant which uses fuel and only needs about 5-10 hours to be fully operational (Cole) or it could be the importation of energy. Consequently, if gas power plants are used as a backup energy source for wind energy, the capital costs and maintenance charges of this power plant are also added to the cost of developing wind turbines. Assuming a gas power plant can replace 100% of the wind farm’s output, that adds an additional $4.5 billion – using the cost and energy output of a well previously analyzed – bringing the total cost of a wind farm to approximately $23 billion. The impact of this additional cost on the electricity bill of residents/consumers is hard to estimate as these turbines are not operational currently.
Conclusively, the difference in the power sources makes it difficult to compare because of their varying factors. For example, gas power plants have low capital costs but high fuel costs while wind farms have high capital cost but no fuel costs, and the fluctuation in costs due to world events have impacted the overall energy expenses. Therefore, cost estimations and comparisons are not precise but was attempted in this project just to give a breakdown on the cost of gas-fueled plants and wind turbines.
Table 1: A comparison of the cost breakdown of natural gas and offshore wind farms as electricity generators.
| Energy Source | Capacity
(MW) |
Cost of Production & Operation
($) |
Energy Cost
($/MMBtu) |
Percentage Increase (%) |
|---|---|---|---|---|
| Natural Gas | 1.64 | 11.6 million | 12 | – |
| Empire Wind 2 | 630 (@ 50% capacity) with an alternative energy source | 23 billion | 31 | 158 |
Greenhouse Gas (GHG) Emission Analysis[edit | edit source]
Natural Gas[edit | edit source]
In 2021, a total of 612.9 million metric tons of CO2 equivalent (MMT CO2 Eq.) was released into the atmosphere in the U.S due to natural gas combustion for the electric power sector. Methane, which is emitted during the production, processing, storage, transmission, distribution and use of natural gas makes up the second largest GHG emitted in the U.S. Also, natural gas and petroleum systems makes up the second largest source of methane emissions after human activities (EPA, 2023). In 2021, the natural gas used for electric power emitted a total of 1.2 MMT CO2 Eq. which makes it the largest contributor to methane emissions in electricity generation. Nitrous oxide emissions from natural gas make up about 3.9 MMT CO2 Eq. Therefore, in total, the GHG emissions from natural gas in the production of electricity amounts to 618 MMT CO2 Eq. It is important to note that this total emission rate only considers electricity generation and not the total natural gas emissions from the entire lifecycle. Therefore, the total emissions in NY in the year 2020 amounted to 23.11 MMT CO2 Eq. in-state for the electrical sector.
Table 2: Total lifetime GHG emissions from a natural gas system from NYSERDA
| Segment | CO2 Emissions
(MMT) |
Methane Emissions
(MMT CO2 Eq.) |
N2O Emissions
(Metric Tons CO2 Eq.) |
Total GHG Emissions
(MMT CO2 Eq.) |
|---|---|---|---|---|
| Exploration | - | 0.2 | 6 | 0.2 |
| Production | 9.1 | 94.1 | 2,779 | 103.2 |
| Processing | 26.1 | 14.3 | 4,300 | 40.4 |
| Transmission and Storage | 0.9 | 44.5 | 422 | 45.4 |
| Distribution | * | 15.3 | - | 15.3 |
| Post-Meter | * | 13.0 | - | 13.0 |
| Total | 36.2 | 181.4 | 7,649 | 217.5 |
* Does not exceed 0.05MMT CO2 Eq.
Offshore Wind Turbine[edit | edit source]
Unlike fossil fuel power plants where emissions occur continuously due to combustion, the GHG emissions generated in a turbine’s lifecycle occurs during its early stages such as in the manufacturing of the parts, transportation to the site, and construction of the turbine; however, during its operation, it has almost a negligible environmental impact. A lifecycle assessment study conducted by Guezuraga et al. (Guezuraga, Zauner, & Pölz, 2012) showed that the average energy payback time for a 2MW capacity wind turbine is about 7 months. The U.S. Department of Energy (U.S. DOE, 2022) found that natural gas produces about 465 g CO2-eq/kWh of electricity generated which is more than 40 times larger than the carbon footprint of wind turbines at 11 g CO2-eq/kWh.
Summary and Conclusion[edit | edit source]
Natural gas is a cleaner and cost-effective fossil fuel is the largest generator of electricity in New York State which has succeeded in acting as a bridge for the replacement of carbon energy consumption and facilitates decarbonization. However, it is still a fossil fuel that emits greenhouse gases like carbon dioxide, methane, and nitrogen oxides and the process of fracking has been banned in NY as a result. There are a lot of limitations in this study including the lack of clear information on the extraction and production costs of natural gas. However, an increase in this consumption has also led to a corresponding increase in the GHG emissions with a 66% increase (NYSERDA, 2022). Therefore, decision makers should be careful not to be fooled by the economic gain of natural gas but be blind to its deteriorating impact on human health and the environment. Natural gas should maintain its purpose as a ‘bridge’ and must be phased out with the replacement of renewable sources of energy.
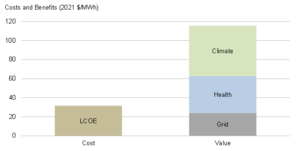
This is a goal NY is trying to achieve with the five offshore wind projects planned to produce approximately 4,300 MW of electricity. This is a massive undertaking because wind projects can be described as very expensive to install with an average cost of $3-4 million per turbine which is 11 times more expensive than a natural gas combined cycle power plant (EIA). These are hypothetical values based on research data and may be more for offshore wind turbines because it requires more energy and materials needed for installation and maintenance. The U.S. DOE analyzed the benefits of wind energy and found that the health and climate benefits with the value of the wind energy electric grid system, when calculated was four times the average unsubsidized levelized cost of energy (see Figure 3).

Finally, the cost and GHG emissions analysis of both natural gas and wind energy conducted in this project did not consider a lot of factors that might influence the results of the analysis. Therefore, more work is needed to determine a more comprehensive analysis of these sources of energy. In my professional opinion, the cost incurred in developing offshore wind farms in New York and the ban on fracking is a step in the right direction if we plan on mitigating the effects of anthropogenic activity on the environment and curbing the further degradation of our planet.
Note: This is an abbreviated report. For the full project report, view the link below.
References[edit | edit source]
- BBC UK. (2022, October 26). What is fracking and why is it controversial? Retrieved from BBC News: https://www.bbc.com/news/uk-14432401
- Blewett, D. (2021, December 20). Wind Turbine Cost: How Much? Are They Worth It In 2022? Retrieved from Weather Guard Lightning Tech: https://weatherguardwind.com/how-much-does-wind-turbine-cost-worth-it/#:~:text=What's%20the%20cost%20of%20a,%242%2D4%20million%20dollar%20range.
- Brown, S., Krupnick, A., & Walls, M. (2009). Natural Gas: A Bridge to a Low-Carbon Future. Resources for the Future; National Energy Policy Institute.
- Cole, S. (n.d.). Intermittency of Wind Power and its Cost Implications. Retrieved from TheRoundup.org: https://theroundup.org/intermittency-of-wind-power/
- Dawes, A., & Majkut, J. (2023, January 31). Tailwinds and Headwinds: The U.S. Offshore Wind Market. Retrieved from Center for Strategic and International Studies: https://www.csis.org/analysis/tailwinds-and-headwinds-us-offshore-wind-market
- Empire Wind. (n.d.). About The Project. Retrieved from Empire Wind: https://www.empirewind.com/about/project/
- EPA. (2023). Inventory of U.S. Greenhouse Gas Emissions and Sinks: 1990-2021. U.S. Environmental Protection Agency, EPA 430-R-23-002.
- EPA. (2023, April 13). Overview of Greenhouse Gases. Retrieved from U.S. Environmental Protection Agency: https://www.epa.gov/ghgemissions/overview-greenhouse-gases#carbon-dioxide
- Guezuraga, B., Zauner, R., & Pölz, W. (2012). Life cycle assessment of two different 2 MW class wind turbines. Renewable Energy, 37(1), 37-44. doi:https://doi.org/10.1016/j.renene.2011.05.008
- IHS Global Inc. (2015). Oil and Gas Upstream Cost Study . Texas.
- Institute for Energy Research . (n.d.). Offshore Wind Energy: A Very, Very Expensive Electricity Source . Retrieved from Institute for Energy Research : https://www.instituteforenergyresearch.org/wp-content/uploads/2013/06/Offshore-Wind-Energy-DRS-4.pdf
- New York State Energy Research and Development Authority (NYSERDA). (n.d.). Offshore Wind Projects. Retrieved from NYSERDA: https://www.nyserda.ny.gov/All-Programs/Offshore-Wind/Focus-Areas/NY-Offshore-Wind-Projects
- NYSERDA. (2022). Energy Sector Greenhouse Gas Emissions under the New York State Climate Act: 1990–2020. Lexington, MA: Eastern Research Group Inc.
- U.S. DOE. (2022, August 16). How Wind Energy Can Help Us Breathe Easier. Retrieved from U.S. DOE: office of ENERGY EFFICIENCY & RENEWABLE ENERGY: https://www.energy.gov/eere/wind/articles/how-wind-energy-can-help-us-breathe-easier
- U.S. EIA. (2022). New York State Profile and Energy Estimates. Retrieved from https://www.eia.gov/state/analysis.php?sid=NY#37
- U.S. EIA. (2023, April 20). New York State Profile and Energy Estiimates. Retrieved from U.S. EIA: https://www.eia.gov/state/data.php?sid=NY#SupplyDistribution
- U.S. Geological Survey. (n.d.). The U.S. Wind Turbine Database. Retrieved from USGS: https://eerscmap.usgs.gov/uswtdb/
- US EIA. (2021, June 1). FREQUENTLY ASKED QUESTIONS (FAQS). Retrieved from US EIA: https://www.eia.gov/tools/faqs/faq.php?id=45&t=8#:~:text=Therefore%2C%20100%20cubic%20feet%20(Ccf,1.037%20MMBtu%2C%20or%2010.37%20therms.
- US EIA. (2022, November 7). Natural gas explained: Natural gas and the environment. Retrieved from US EIA: https://www.eia.gov/energyexplained/natural-gas/natural-gas-and-the-environment.php
- US EIA. (2022). U.S. Oil and Natural Gas Wells by Production Rate.
- WINDUSTRY. (n.d.). How much do wind turbines cost? Retrieved from WINDUSTRY: https://www.windustry.org/how_much_do_wind_turbines_cost