No higher resolution available.
Table_C-2.png (752 × 355 pixels, file size: 28 KB, MIME type: image/png)
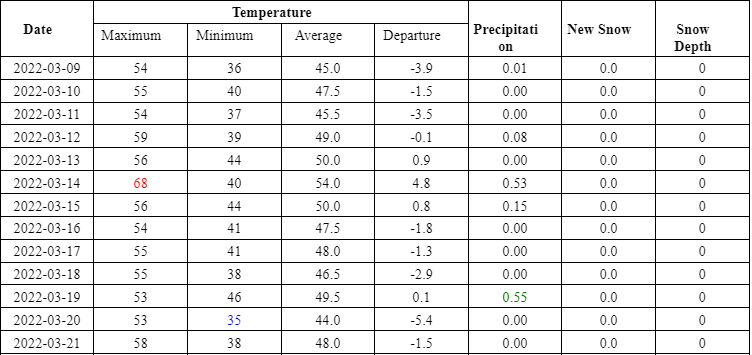
Table C-2 represents the precipitation data for the collection month; 03/09/2022 - 04/06/2022.
File history
Click on a date/time to view the file as it appeared at that time.
| Date/Time | Thumbnail | Dimensions | User | Comment | |
|---|---|---|---|---|---|
| current | 22:28, 17 March 2023 | | 752 × 355 (28 KB) | Paola Moreno (talk | contribs) | Uploaded a work by Margarita Otero-Diaz, Alice De Lescure, Amanda Ratcliff, Justin Romani from Effects of Industries on the Portion of Jane’s Creek Located Around “The Ditch” with UploadWizard |
You cannot overwrite this file.
File usage
The following page uses this file: