


File:Table A-1 Jane's Creek WQ Project.png
No higher resolution available.
Table_A-1_Jane's_Creek_WQ_Project.png (749 × 305 pixels, file size: 15 KB, MIME type: image/png)
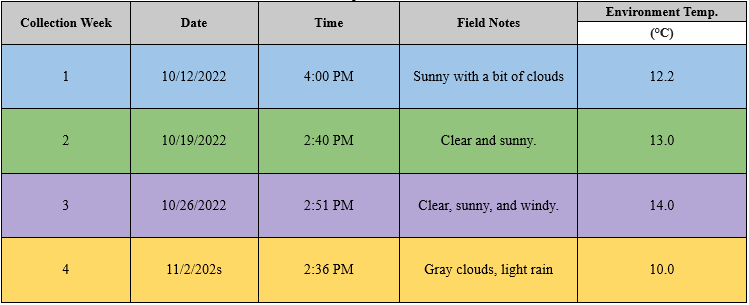
Table A-1 represents the data collected for the upstream site(T4T) for 4 weeks; 10/12/2022 - 11/02/2022
| Date created | March 16, 2023 |
|---|---|
| Author | Margarita Otero-Diaz Alice De Lescure Amanda Ratcliff Justin Romani |
| License | CC-BY-SA-4.0 |
| Date uploaded | March 16, 2023 |
| Uploader | Paola María Moreno |
| Source | Effects of Industries on the Portion of Jane’s Creek Located Around “The Ditch” |
File history
Click on a date/time to view the file as it appeared at that time.
| Date/Time | Thumbnail | Dimensions | User | Comment | |
|---|---|---|---|---|---|
| current | 19:52, 16 March 2023 | | 749 × 305 (15 KB) | Paola Moreno (talk | contribs) | Uploaded a work by Margarita Otero-Diaz, Alice De Lescure, Amanda Ratcliff, Justin Romani from Effects of Industries on the Portion of Jane’s Creek Located Around “The Ditch” with UploadWizard |
You cannot overwrite this file.
File usage
The following page uses this file: