This special page shows all uploaded files.
| Date | Name | Thumbnail | Size | Description | Versions |
|---|---|---|---|---|---|
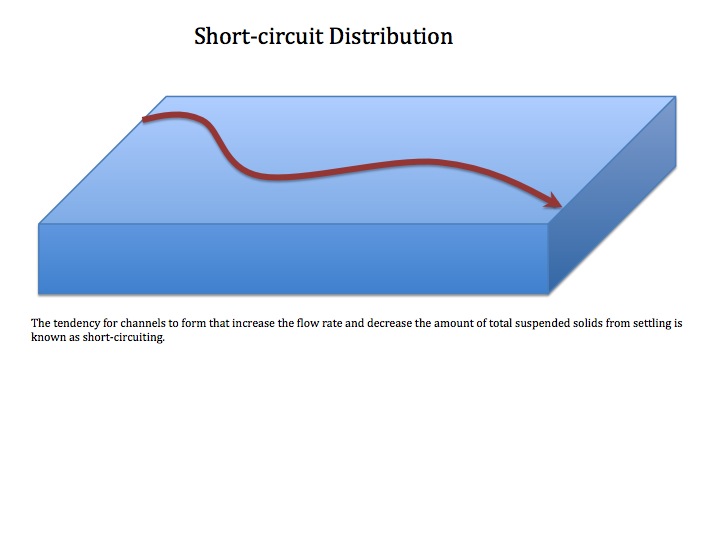
| 21:02, 20 April 2008 | ShortCurcuit.jpg (file) |  |
40 KB | A diagram of a short-circuit through a settling tank | 1 |
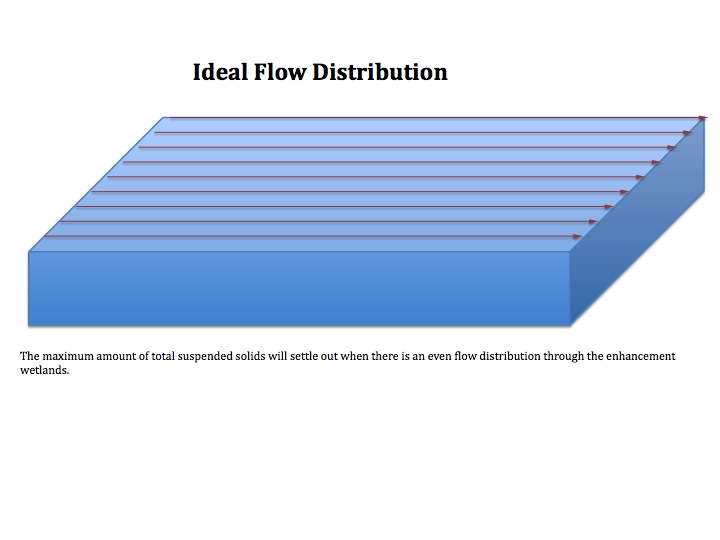
| 20:59, 20 April 2008 | IdealFlowDistribution.jpg (file) |  |
48 KB | An ideal flow distribution for maximum settling of suspended solids. | 1 |
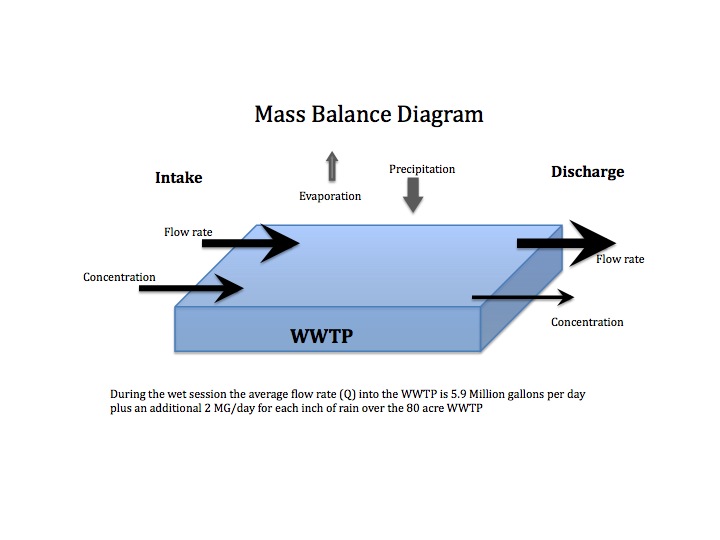
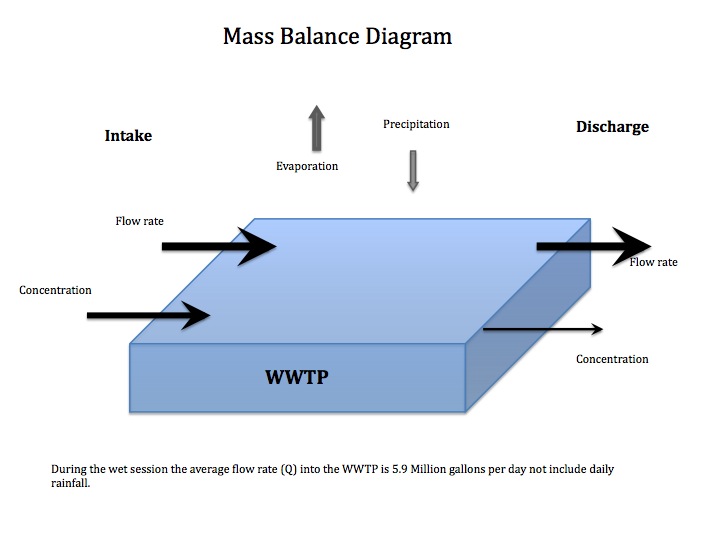
| 20:57, 20 April 2008 | MassBalanceDiagram precipitation.jpg (file) |  |
44 KB | Mass balance diagram for Arcata's wastewater treatment plant during the wet session with daily rainfall included. | 1 |
| 20:56, 20 April 2008 | MassBalanceDiagram wet.jpg (file) |  |
44 KB | Mass balance diagram for Arcata's wastewater treatment plant during the wet session | 1 |
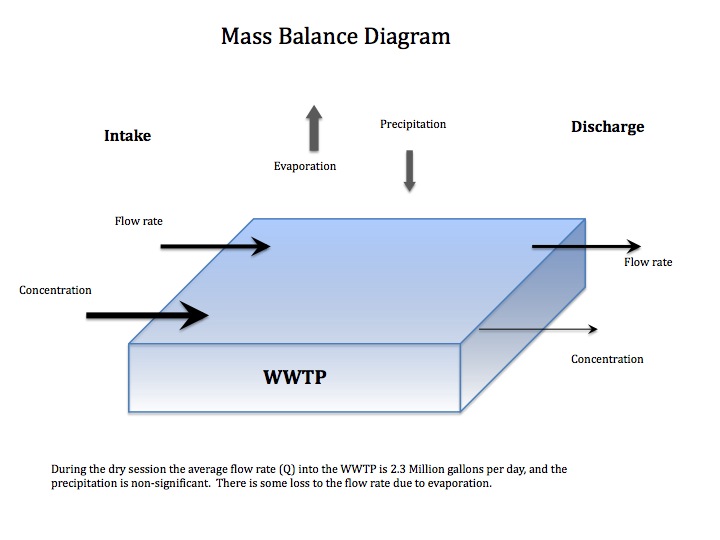
| 20:36, 20 April 2008 | MassBalanceDiagram dry.jpg (file) |  |
48 KB | Dry session mass balance flow diagram for Arcata WWTP | 1 |
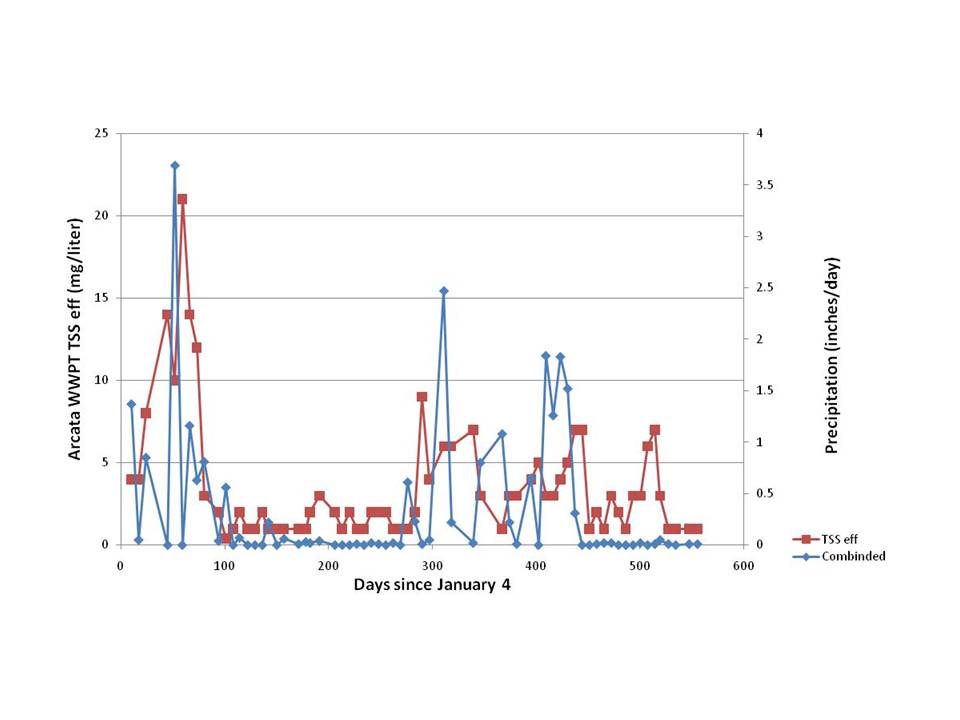
| 18:54, 18 April 2008 | Comparision.jpg (file) |  |
42 KB | The Arcata Wastewater Treatment Plant TSS data comes from Eric Lust. The precipitation data comes from NOAA website http://www1.ncdc.noaa.gov/pub/orders/CDO7201361339900.txt The station: ARCATA AIRPORT, CA UNITED STATES GSOD ID: 72594524283 The combined v | 1 |
| 06:57, 1 April 2008 | Arcata-7128 r.jpg (file) |  |
85 KB | 1 | |
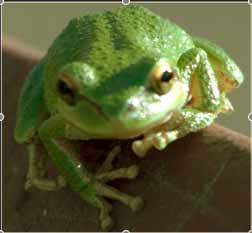
| 06:39, 1 April 2008 | Snapshot 2008-03-31 22-10-34.jpg (file) |  |
37 KB | frogs too | 1 |
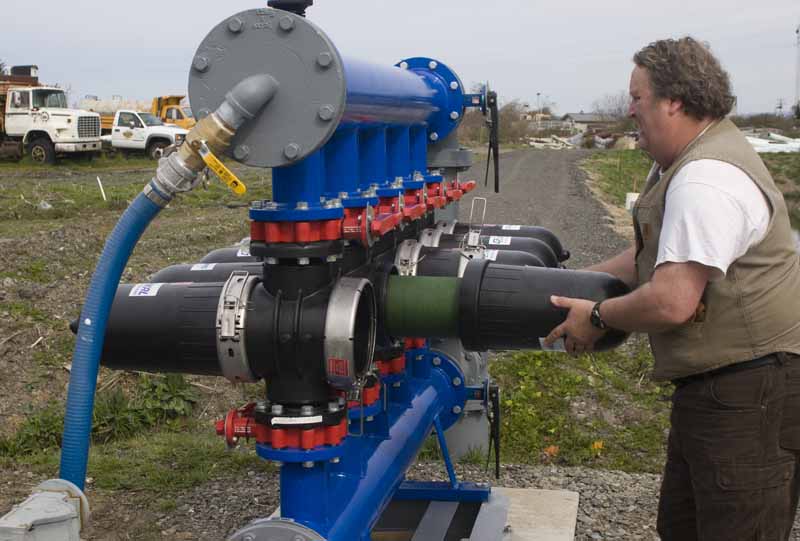
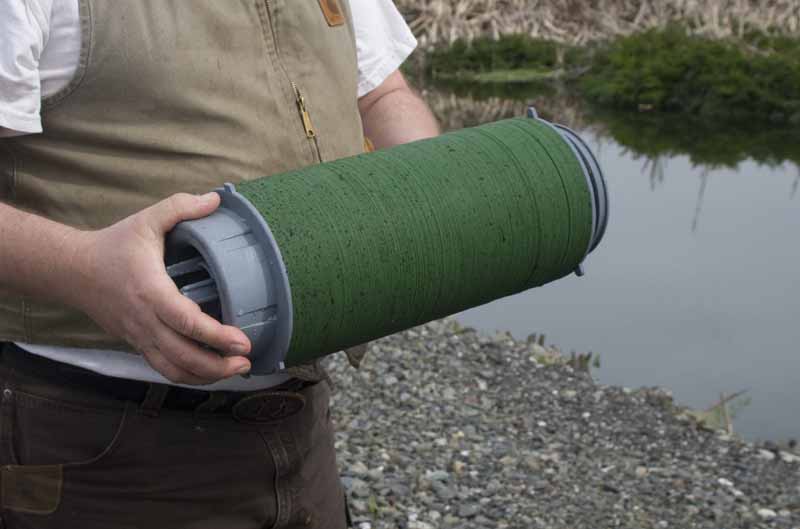
| 06:38, 1 April 2008 | Arcata-7125 r.jpg (file) |  |
64 KB | filter | 1 |
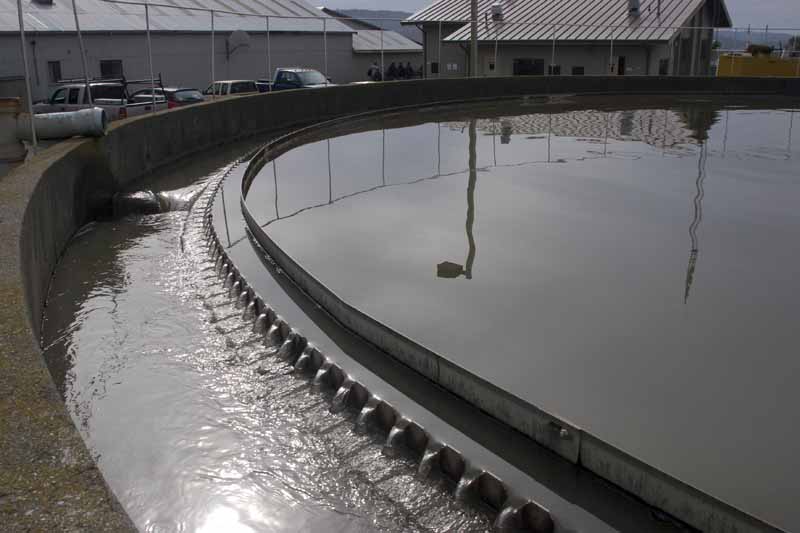
| 06:36, 1 April 2008 | Arcata-7074 r.jpg (file) |  |
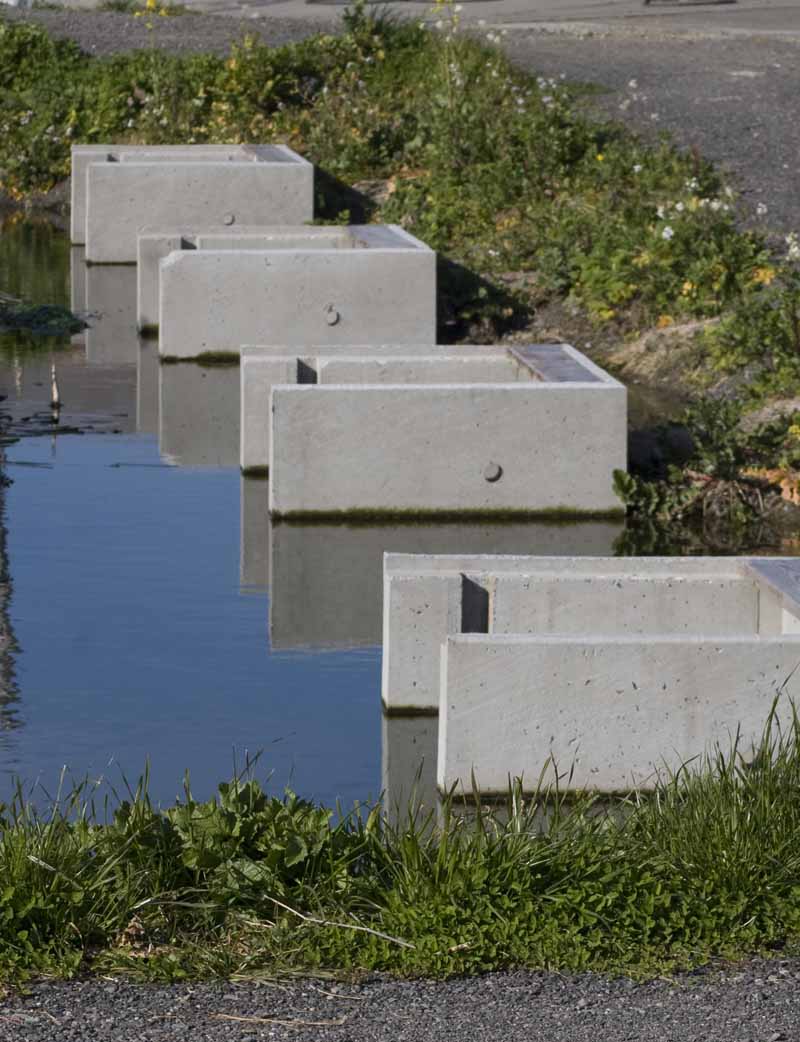
72 KB | clarifier example of slowing and spreading out the discharge | 1 |
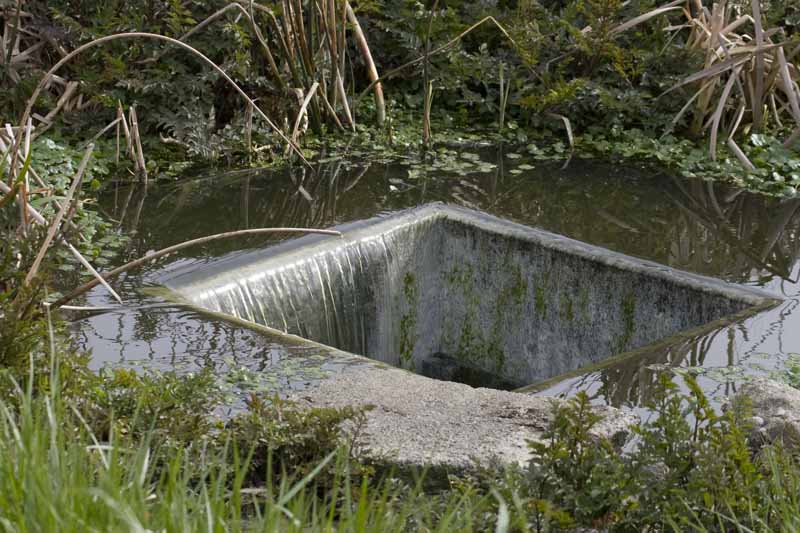
| 06:34, 1 April 2008 | Arcata-7122 r.jpg (file) |  |
111 KB | intake | 1 |
| 06:32, 1 April 2008 | Arcata-7028 r.jpg (file) |  |
127 KB | intake | 1 |
| 23:59, 30 March 2008 | Flow Process diagram r2.jpg (file) |  |
145 KB | temporary example idea | 1 |
| 19:57, 30 March 2008 | INF vs Eff TSS 010102 091903 2 3.jpg (file) |  |
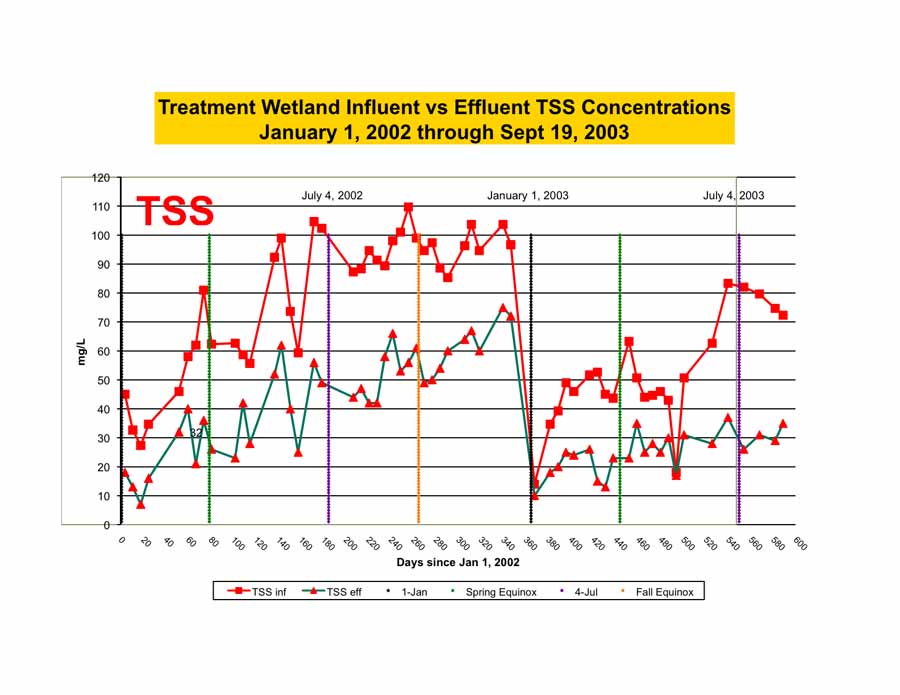
96 KB | Modified image (triangles for squares in graph of TSS eff) from data compiled by Eric C. Lust from the Arcata WWTF | 1 |
| 19:54, 30 March 2008 | Enhancement TSS inf eff 2 3.jpg (file) |  |
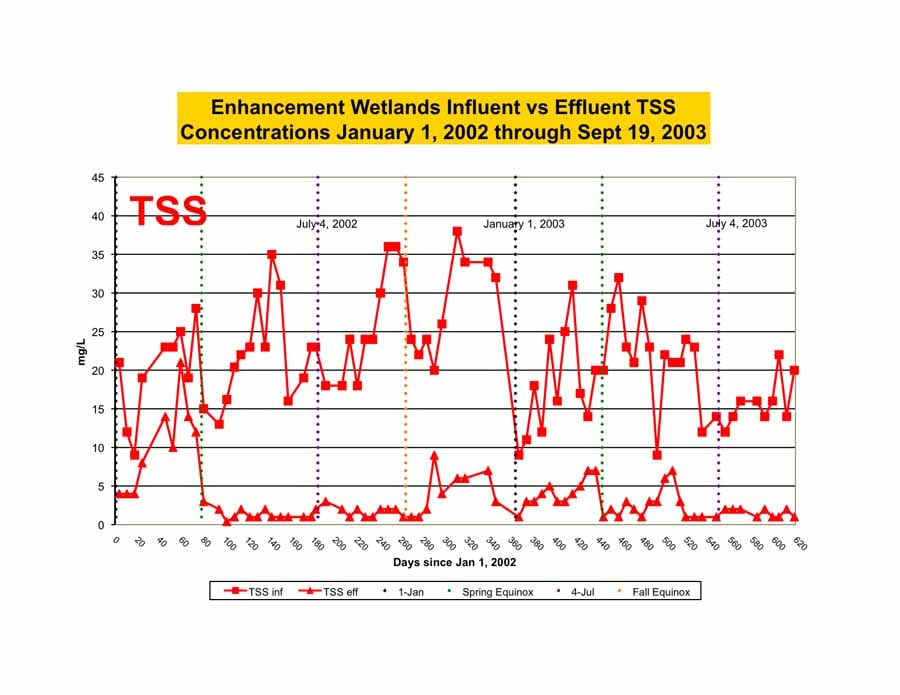
96 KB | Modified image (triangles for squares in graph of TSS eff) from data compiled by Eric C. Lust from the Arcata WWTF | 1 |
| 20:01, 29 March 2008 | Flow Process diagram r.jpg (file) |  |
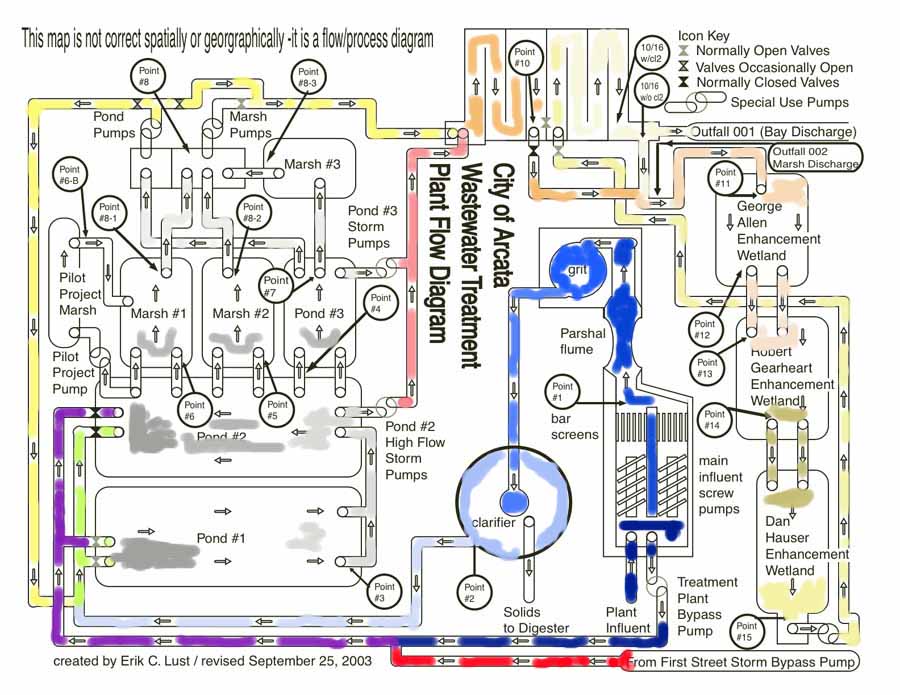
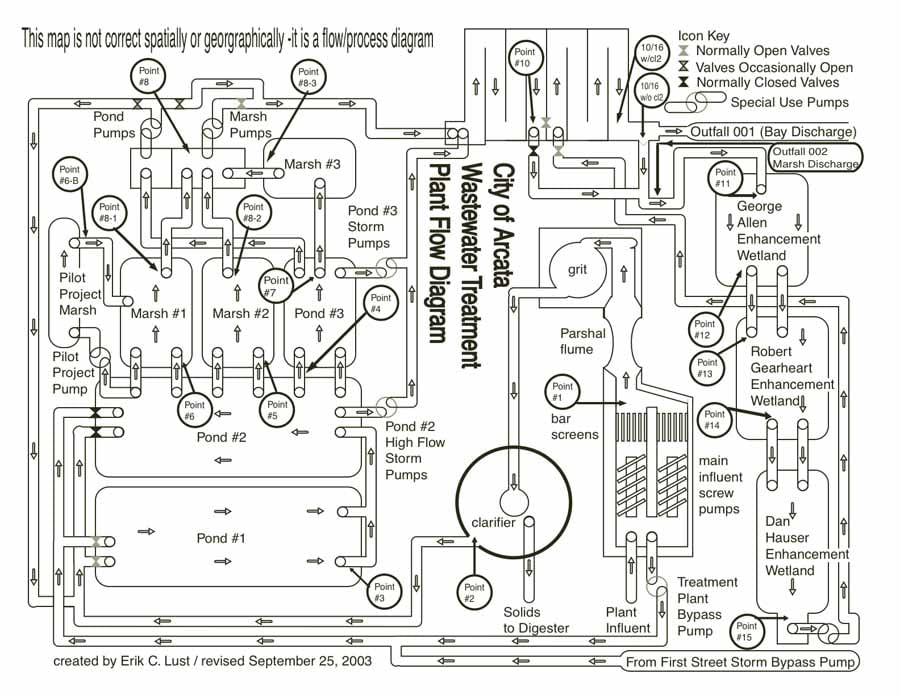
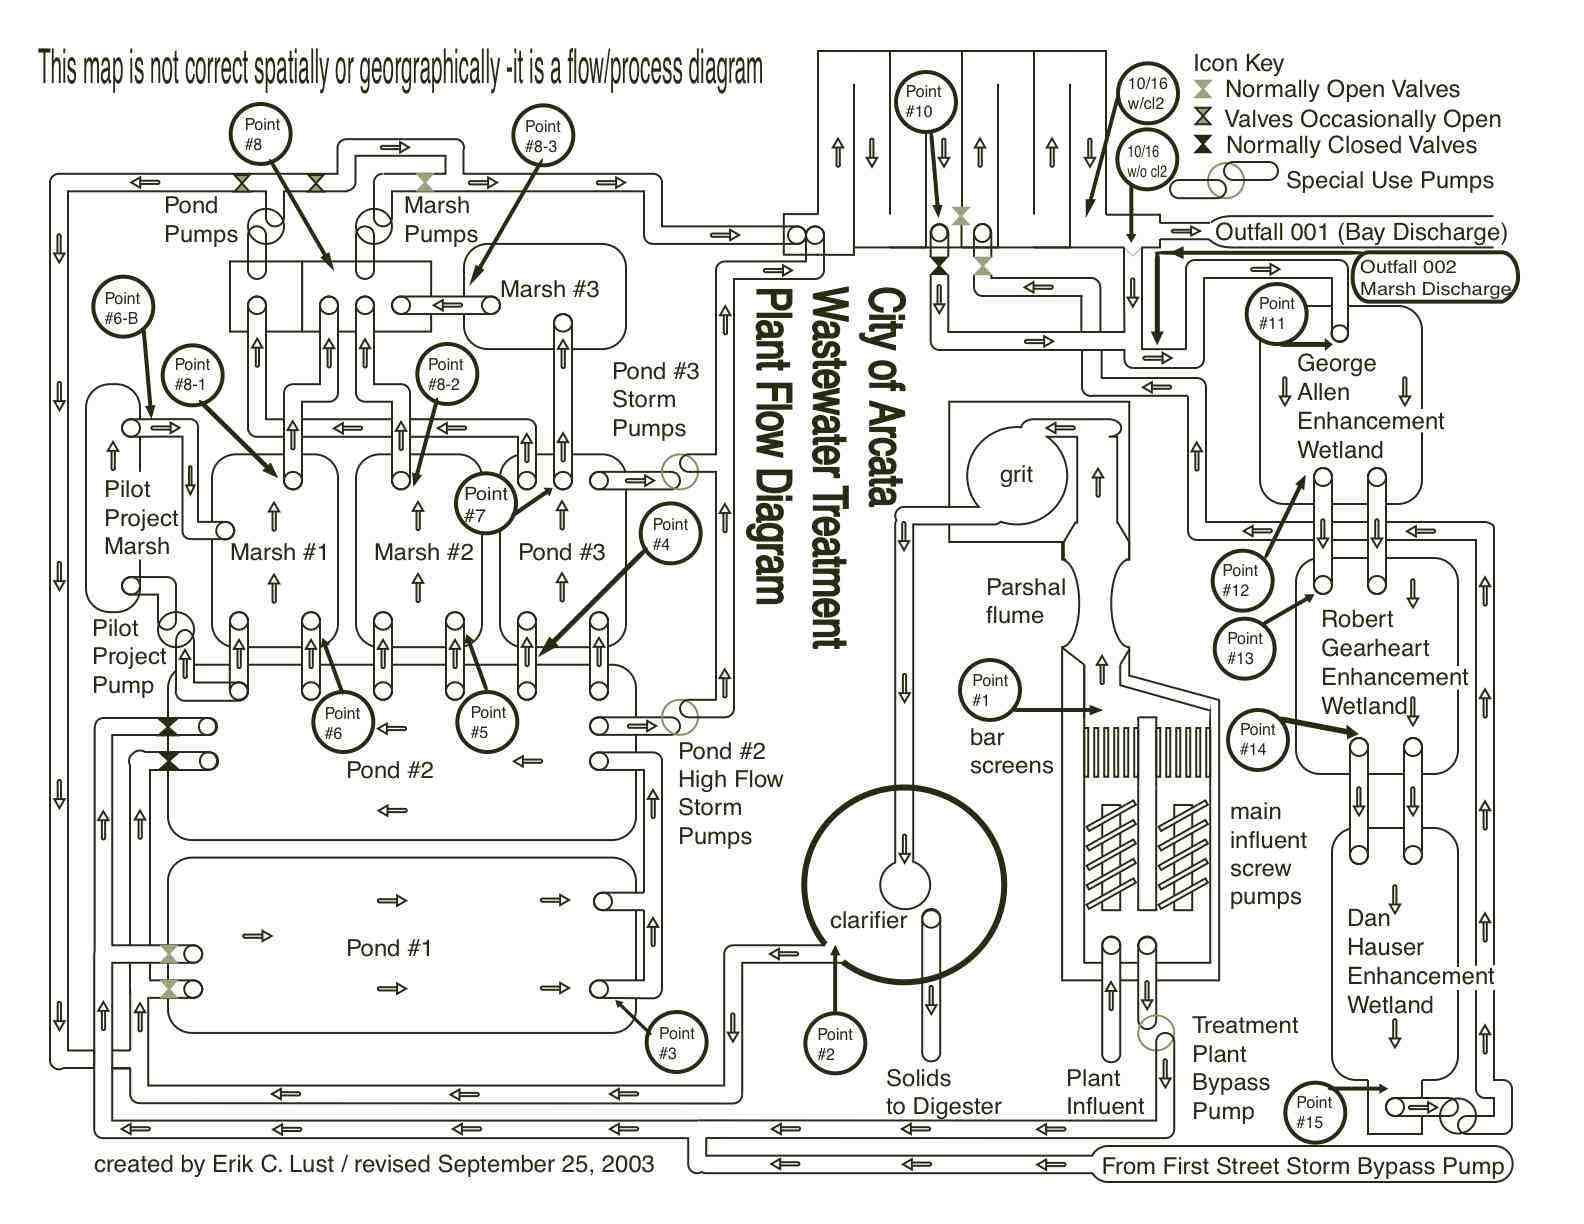
141 KB | The City of Arcata Wastewater Treatment Plant Flow Diagram This issue is concerned with Outfall 001 Bay Discharge and Outfall 002 Marsh Discharge. Data from the Points 5, 6, & 7 corresponding to Marshes 1, 2, & Pond 3 will also used. | 1 |
| 19:39, 29 March 2008 | Flow Process diagram lowQ.jpg (file) |  |
171 KB | The City of Arcata Wastewater Treatment Plant Flow Diagram This issue is concerned with Outfall 001 Bay Discharge and Outfall 002 Marsh Discharge. Data from the Points 5, 6, & 7 corresponding to Marshes 1, 2, & Pond 3 will also used. | 1 |
| 19:31, 29 March 2008 | Flow Process diagram.pdf (file) | 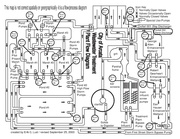 |
117 KB | The City of Arcata Wastewater Treatment Plant Flow Diagram This issue is concerned with Outfall 001 Bay Discharge and Outfall 002 Marsh Discharge. Data from the Points 5, 6, & 7 corresponding to Marshes 1, 2, & Pond 3 will also used. | 1 |