
File:Mca-agrivoltaic.jpg
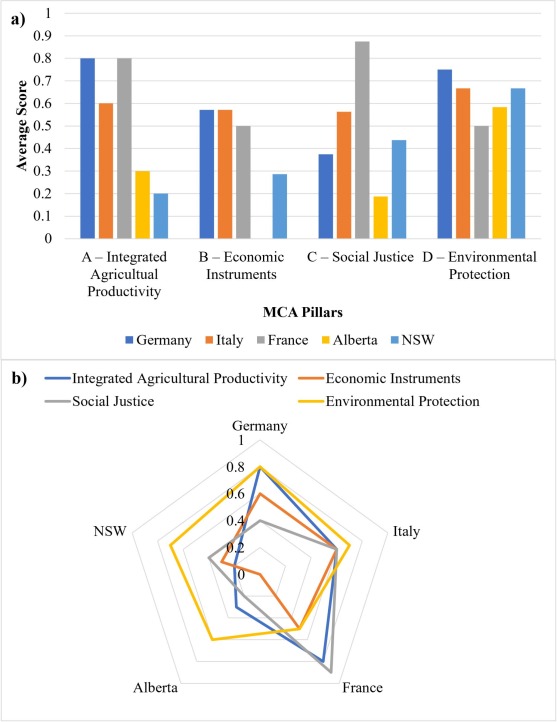
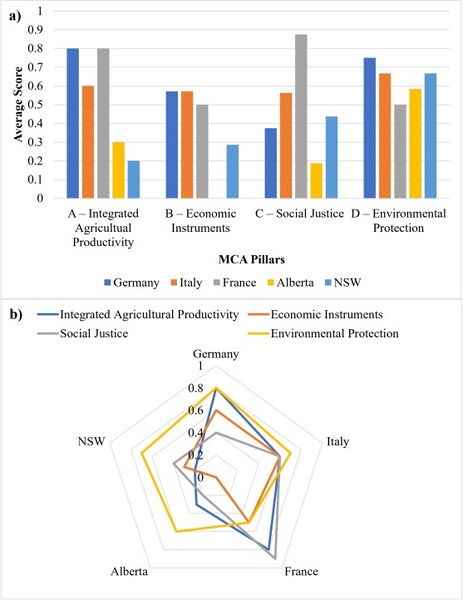
Comparative performance of the five jurisdictions across the four evaluation pillars: (a) bar chart and (b) radar chart. The bar chart highlights relative strengths and weaknesses pillar by pillar emphasizing direct numerical comparison, while the radar chart provides an integrated view of balance and gaps across the entire framework highlighting multidimensional balance. Both charts use a 0–1 scale where higher values indicate stronger policy and regulatory alignment with just transition objectives. France demonstrates the strongest overall performance in Social Justice, whereas Germany excels in Agricultural Productivity, underscoring differing regulatory approaches to just agrivoltaics.
| Date created | December 13, 2025 |
|---|---|
| Author | Joshua M. Pearce |
| Date uploaded | December 13, 2025 |
| Uploader | Joshua M. Pearce |
| Source | Own work |
| License | CC-BY-SA-4.0 |
File history
Click on a date/time to view the file as it appeared at that time.
| Date/Time | Thumbnail | Dimensions | User | Comment | |
|---|---|---|---|---|---|
| current | 22:02, 13 December 2025 | | 557 × 722 (63 KB) | J.M.Pearce (talk | contribs) | Uploaded own work with UploadWizard |
You cannot overwrite this file.
File usage
The following page uses this file: