
File:Informe cacao - Imagen 5.png
Size of this preview: 800 × 480 pixels. Other resolution: 905 × 543 pixels.
Original file (905 × 543 pixels, file size: 57 KB, MIME type: image/png)
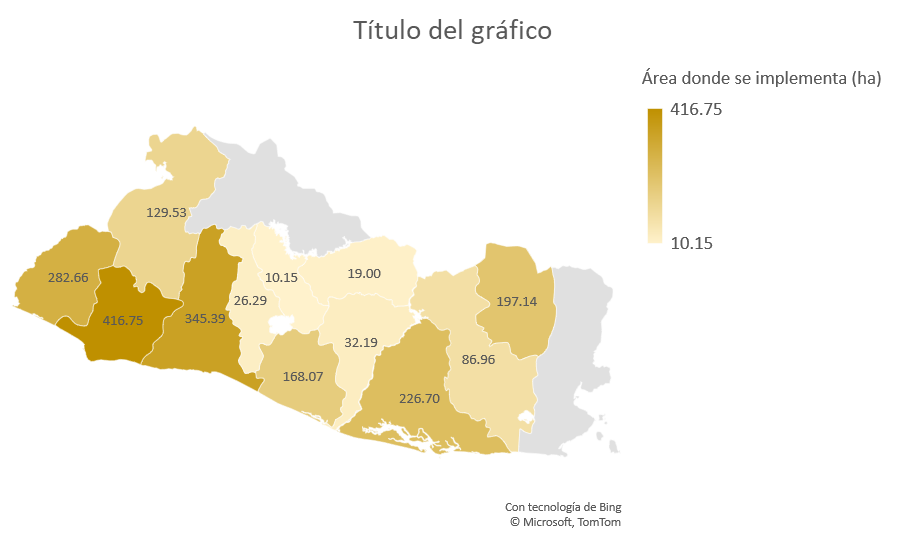
Gráfico 3-3: Cantidad de hectáreas influenciadas por la implementación de curvas a nivel, por departamento.
| Date created | October 28, 2024 |
|---|---|
| Author | Catholic Relief Services |
| Date uploaded | October 28, 2024 |
| Uploader | Paola María Moreno |
| Source | https://docs.google.com/document/d/1r9AgRhgPrOgvXi0BGHAL91uTE3jSUNTwKn5jybDTPyw/edit?tab=t.0 |
| License | CC-BY-SA-4.0 |
File history
Click on a date/time to view the file as it appeared at that time.
| Date/Time | Thumbnail | Dimensions | User | Comment | |
|---|---|---|---|---|---|
| current | 17:08, 28 October 2024 | | 905 × 543 (57 KB) | Paola Moreno (talk | contribs) | Uploaded a work by Catholic Relief Services from https://docs.google.com/document/d/1r9AgRhgPrOgvXi0BGHAL91uTE3jSUNTwKn5jybDTPyw/edit?tab=t.0 with UploadWizard |
You cannot overwrite this file.
File usage
The following page uses this file: