Zat murni adalah zat yang homogen (yakni, zat tersebut mempunyai komposisi kimia yang sama di seluruh zat), dan dapat berada dalam tiga fase (gas, cair, dan padat). Sifat-sifat zat murni dapat membantu dalam memahami prinsip termodinamika.
Sifat-sifat umum zat murni meliputi: suhu, tekanan, volume, massa, jenis massa, volume spesifik, energi, entalpi, dan entropi. Properti ini dapat diringkas menjadi ekstensif atau intensif. Properti intensif adalah properti yang tidak bergantung pada ukuran sistem. Suhu adalah contohnya. Properti ekstensif adalah properti yang bergantung pada ukuran sistem. Contohnya termasuk massa dan volume.
Istilah-istilah penting ketika dihadapkan dengan zat murni meliputi:
- Penguapan, yaitu titik dimana suatu zat cair berubah menjadi fasa uap
- Kondensasi, yaitu titik di mana uap berubah menjadi fasa cair (dan merupakan titik yang sama dengan penguapan)
- Meleleh, yaitu titik berubahnya zat padat menjadi cair
- Membeku, yaitu peristiwa berubahnya zat cair menjadi padat
- Sublimasi, yaitu peristiwa berubahnya zat padat menjadi uap secara langsung
- Desublimasi, yaitu titik di mana uap langsung berubah menjadi padat (tidak biasa tetapi ternyata terjadi)
- Titik kritis, merupakan titik dimana kurva uap jenuh dan cairan jenuh bertemu dan menjadi satu dan sama.
- Titik tripel, adalah titik di mana semua fasa padat, cair, dan gas berada pada waktu yang sama dalam kesetimbangan.
Diagram Spesifik Pv
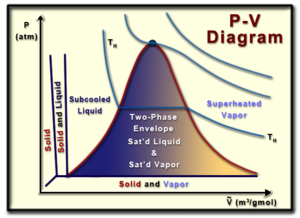
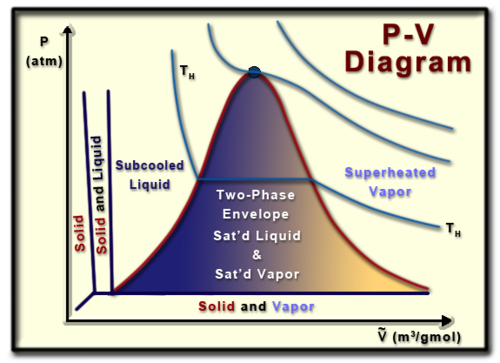
Diagram volume tekanan (atau diagram PV) adalah representasi visual dari tekanan dan volume suatu zat murni tertentu (zat yang homogen). Memahami diagram PV sangat membantu dalam memahami sifat-sifat zat murni, yang merupakan aspek penting dari termodinamika.
Dimulai dari bagian atas grafik, titik kritisnya adalah lokasi di mana tidak ada perbedaan antara fase gas dan cair suatu zat. Pada titik ini cairan jenuh dan uap jenuh menjadi fluida yang sama, menyebabkan volume molar cairan jenuh dan uap jenuh menjadi sama.
Sisi kiri kurva lambang melambangkan garis cairan jenuh, sedangkan sisi kanan kurva lonceng melambangkan garis uap jenuh. Cairan atau uap jenuh akan terletak pada garis yang sesuai, dan tepat di tempat cairan jenuh atau menguap pada tekanan yang ada. Di dalam kurva lonceng terdapat apa yang disebut melodi dua fasa, dimana fasa cair dan gas suatu zat ada pada waktu yang sama. Dalam keadaan ini suatu zat dikatakan mempunyai kualitas tertentu (x), dimana persen kualitas suatu zat adalah perbandingan jumlah uap jenuh terhadap massa total zat tersebut. Secara matematis kualitas dapat didefinisikan sebagai:
m

where mg= mass of the gas and m= the mass of the whole substance
Quality can never exceed 100%. In the two-phase envelope it is important to realize that temperature and pressure are dependent. When determining a substance's state, pressure and temperature cannot be specified concurrently.
Equations
For pure substances there are a few important equations which can be understood from the P-v graph, or its variation in a T-v (temperature-volume), P-T (pressure-temperature) graph, and so on.
To determine the total volume of the mixture, first recognize that this is the sum of the volume occupied by the liquid and the sum of the volume occupied by the gas. This can be defined as:
mv = mfvf+mgvg
specific volume can be defined as:
v = vf+x*(vg-vf)
Finally, recognize that the percent liquid by mass can be understood as 100(1-x) while the percentage vapor can be understood as 100x.
T-v diagram
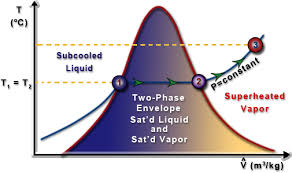
A T-v diagram demonstrates the relationship of a pure substance between temperature and volume. The curves on this diagram are isobars, or lines of constant pressure. Under the two phase envelope, although the substance has some sort of quality the molar volume of a saturated vapor or liquid at a certain pressure can be read straight off the graph. That is, the properties of saturated liquids and saturated vapors are independent of quality.
On this diagram, to the left of the two phase envelope the substance would be a subcooled liquid (because the temperature would be less than the saturation temperature). To the right of the two phase envelope the substance would be a superheated vapor (because the temperature would be greater than the saturation temperature).
P-T diagram
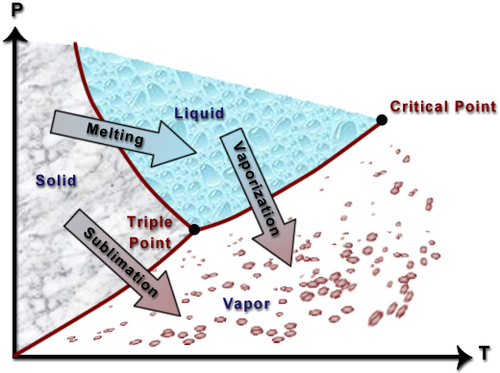
A P-T diagram shows the relationship of a pure substance between pressure and temperature. This diagram displays the properties of a substance that expands upon freezing (such as water).
As can be noted from this diagram, the liquid exists at a pressure above the vapor (the vapor pressure). As such the liquid can be referred to as a compressed liquid. Following the arrows on the diagram demonstrates what needs to be done in order for a phase change to occur. For instance, let's say you had water existing in the middle of the solid range. If you kept pressure constant and solely raised the temperature, the solid would melt into a liquid. Likewise, for most of the liquid region if pressure was decreased while temperature was kept constant, the liquid would vaporize into a gas.
References
All of the information on this page comes from www.learnthermo.com and from "Thermodynamics for Engineers, second edition"


