Size of this preview: 800 × 583 pixels. Other resolution: 972 × 708 pixels.
Original file (972 × 708 pixels, file size: 41 KB, MIME type: image/png)
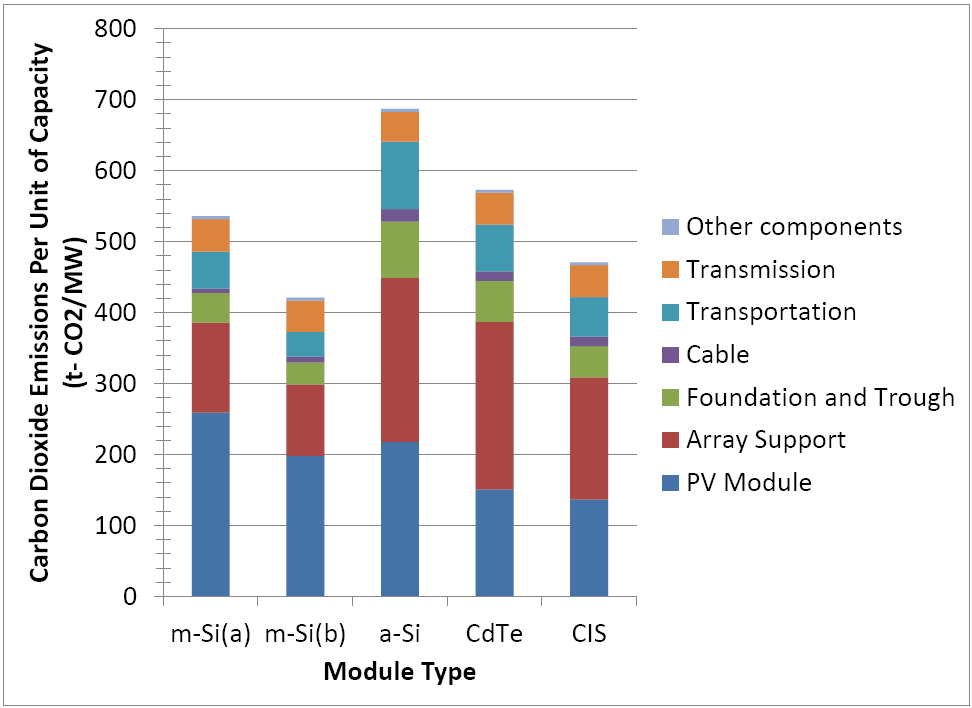
Graph of CO2 emissions per megawatt of photovoltaic installations, based on a table in Progress in Photovoltaics Research: http://www3.interscience.wiley.com/journal/114262504/abstract?CRETRY=1&SRETRY=0
File history
Click on a date/time to view the file as it appeared at that time.
| Date/Time | Thumbnail | Dimensions | User | Comment | |
|---|---|---|---|---|---|
| current | 05:41, 21 March 2010 | | 972 × 708 (41 KB) | James Apple (talk | contribs) | Graph of CO2 emissions per megawatt of photovoltaic installations, based on a table in Progress in Photovoltaics Research: http://www3.interscience.wiley.com/journal/114262504/abstract?CRETRY=1&SRETRY=0 |
You cannot overwrite this file.
File usage
The following page uses this file: