


File:Grid impact export.png
Size of this preview: 800 × 340 pixels. Other resolution: 2,083 × 886 pixels.
Original file (2,083 × 886 pixels, file size: 92 KB, MIME type: image/png)
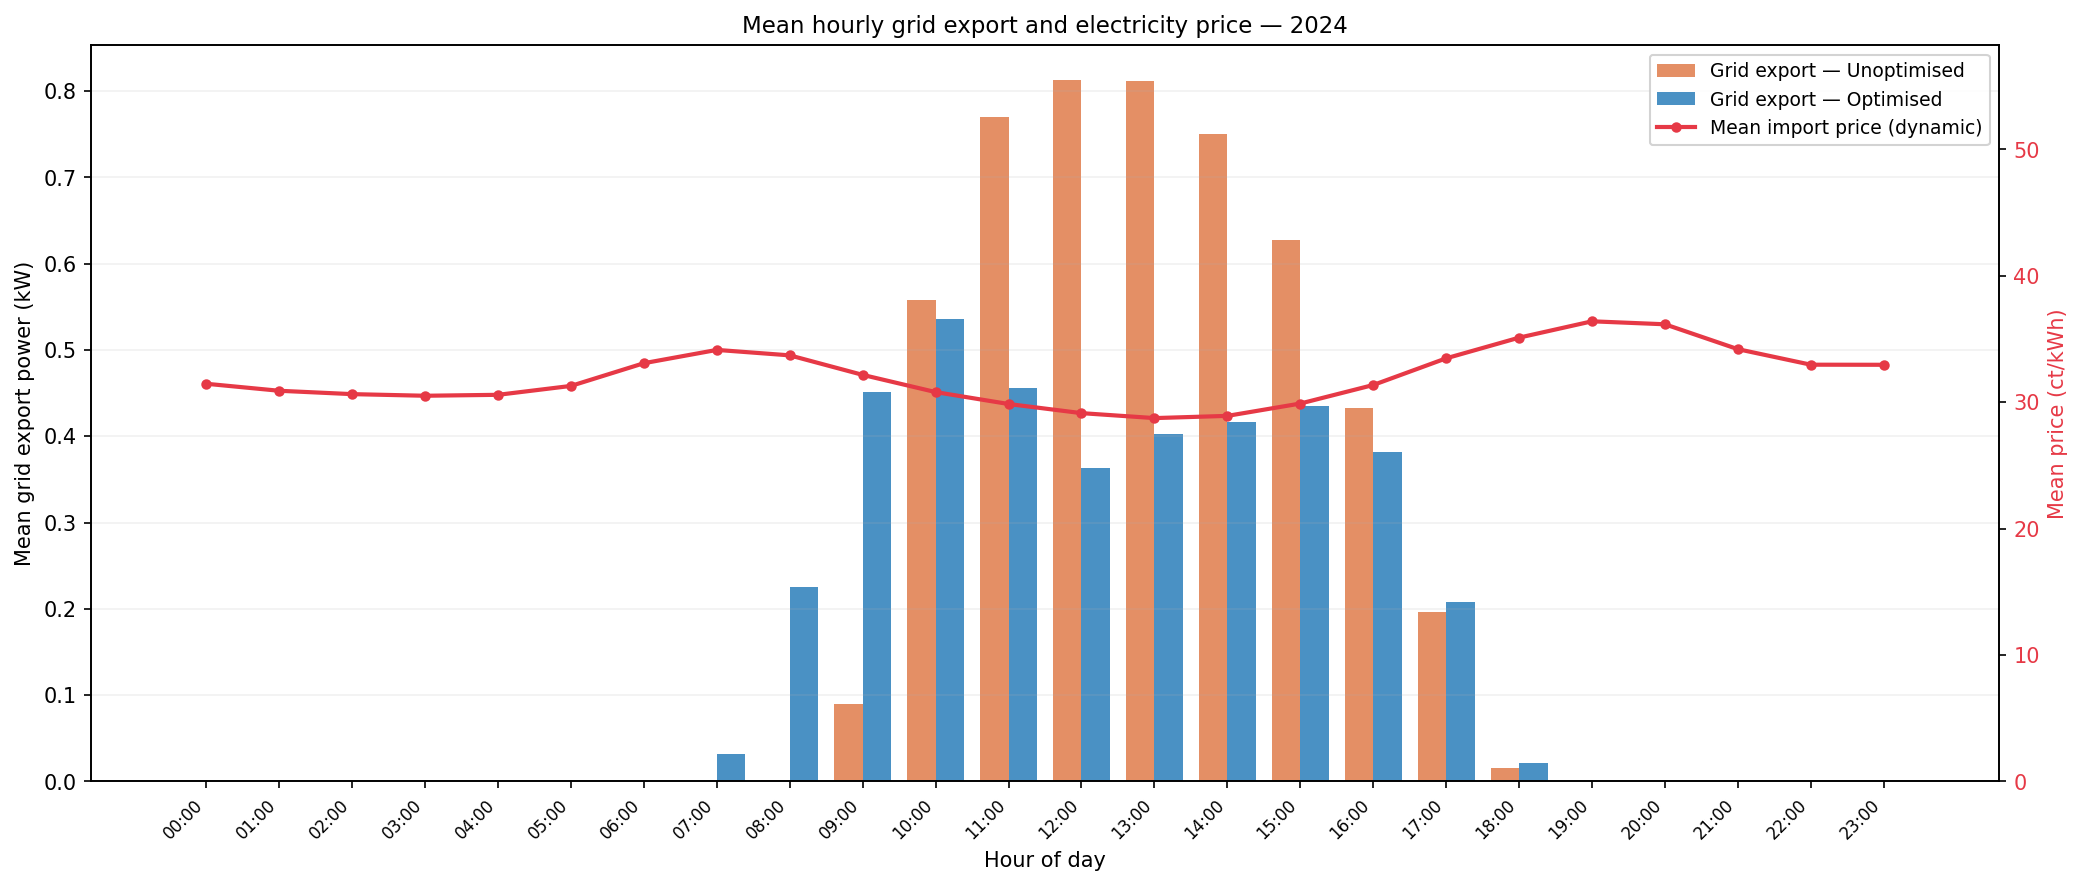
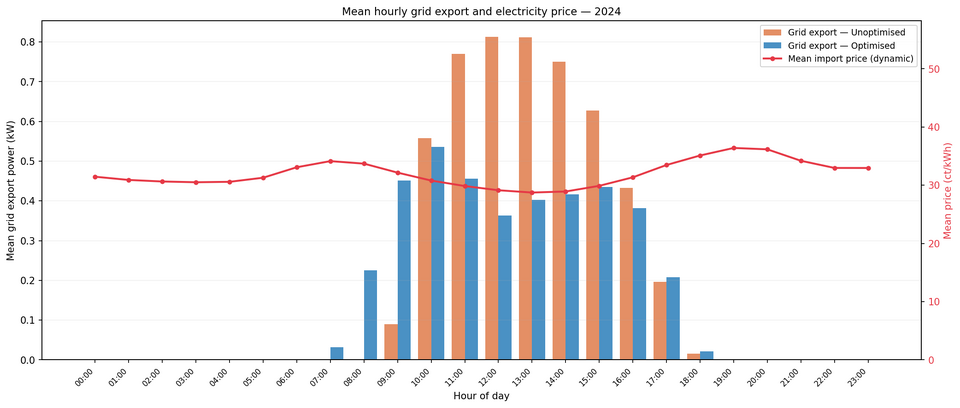
A plot showing the exported energy with and without the optimisation, and also the dynamic electricty price, for a mean average day sampled from one year.
| Date created | July 13, 2026 |
|---|---|
| Author | Dragonfly7211 |
| Date uploaded | July 13, 2026 |
| Uploader | Dragonfly7211 |
| Source | Own work |
| License | CC-BY-SA-4.0 |
File history
Click on a date/time to view the file as it appeared at that time.
| Date/Time | Thumbnail | Dimensions | User | Comment | |
|---|---|---|---|---|---|
| current | 05:30, 13 July 2026 | | 2,083 × 886 (92 KB) | Dragonfly7211 (talk | contribs) |
You cannot overwrite this file.
File usage
The following page uses this file: