No higher resolution available.
CCAT2017colorscale.png (244 × 431 pixels, file size: 2 KB, MIME type: image/png)
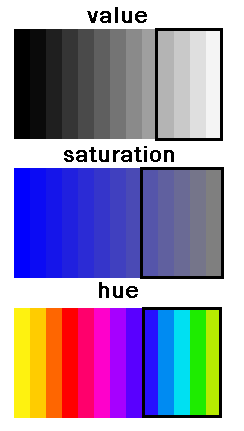
These are the hue, saturation, and value scales. These scales, used in color theory, were used as criteria to see how to best restrict our color options to what the client wants. The black boxes indicate the regions we are restricted to.
File history
Click on a date/time to view the file as it appeared at that time.
| Date/Time | Thumbnail | Dimensions | User | Comment | |
|---|---|---|---|---|---|
| current | 07:00, 6 February 2017 | | 244 × 431 (2 KB) | Tessykins (talk | contribs) | |
| revert | 18:31, 5 February 2017 | 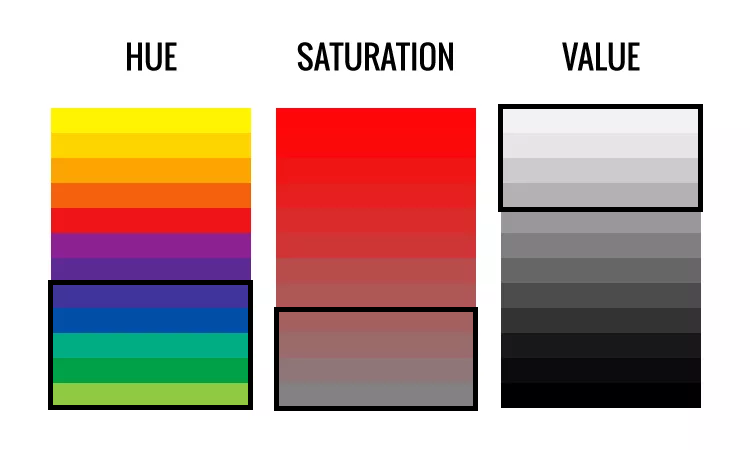 | 750 × 450 (27 KB) | Tessykins (talk | contribs) | I had missed the lightest "value" bar because I could not see it in my image editor. The full "restricted ranges" are now shown. |
| revert | 18:19, 5 February 2017 | 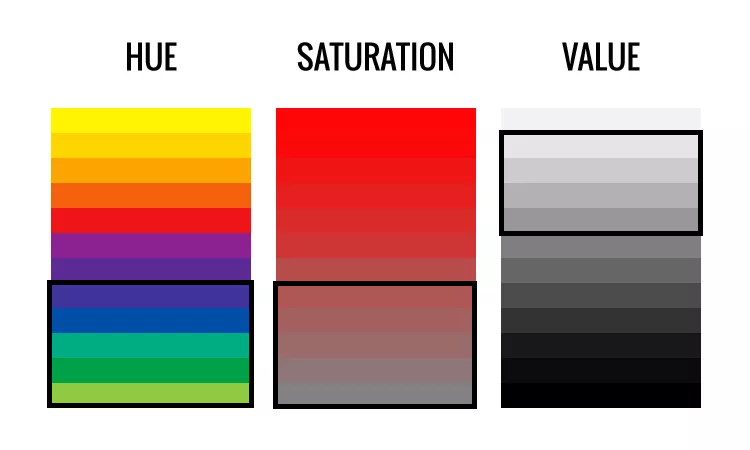 | 750 × 450 (26 KB) | Tessykins (talk | contribs) | These are the hue, saturation, and value scales. These scales, used in color theory, were used as criteria to see how to best restrict our color options to what the client wants. The black boxes indicate the regions we are restricted to. |
You cannot overwrite this file.
File usage
The following page uses this file: