WetLand is an art installation on the Delaware River, for more information visit the Appropedia page: WetLand. WetLand is supplied with electricity by solar panels connected to four 12v batteries. The amount of sunlight and arrangement of batteries will affect the amount energy the system can produce. The amount of electricity stored in the batteries will change daily due to the varying concentrations of sunlight as well as the amount of loads(light bulbs, water pumps, laptops, etc.). It is important that the inhabitants of WetLand are informed on the state of the batteries as well as the amount of electricity being produced in order to accommodate their use accordingly.
Commercial and Hobbyist Energy Monitors[edit | edit source]
There are a good number of energy monitors out there. Most of which only work in the AC world (i.e. your homes, the coffee shop, the classic wall plug), and the monitoring systems designed for a PV system are normally tied in with an expensive charge controller. However we found some great inspirations out there, and their links are listed below listed below.
- Some awesome arduino videos, most of which are dealing with solar panels.
- More awesome arduino videos, as well as a lot of videos on electricity, most of which are dealing with solar power.
- This is an awesome open-source energy monitor designed for household use.
Objective[edit | edit source]
We would like to provide WetLand with a monitor that is designed to inform the inhabitants of the energy being produced and stored. It will also act as a warning system when the health of the batteries are in danger.
Criteria[edit | edit source]
The Table-1(sortable) below explains our criteria and list in them in order of importance.
| Criterion: | Weights | Constraints: |
|---|---|---|
| Cost | 10 | Less than $325 |
| Safety | 10 | Won't harm anyone: Grounded and well insulated (OSHA) |
| Accuracy | 9 | Less than 5% error |
| Maintainability | 9 | Less than an hour a week |
| Interpretability | 8 | Easily understandable for the public |
| Aesthetics | 6 | Dystopian |
| Reproducibility | 6 | Anyone can recreate |
The Final Design[edit | edit source]
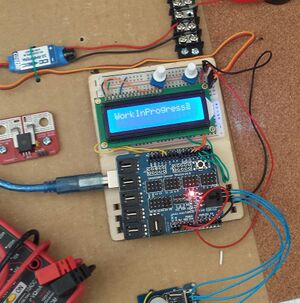
Our design passes the electricity of the batteries and solar panels through their own respective current sensor. The current sensor sends an analog signal to an Arduino Uno which processes the data and displays...... on our color-changing LCD. The LCD is programmed to change color depending on how much energy is being used. Also, a piezo buzzer is set off when the energy consumed threatens the batteries. Wattage will be calculated using a real-time clock, an SD card, and a few lines of code. The monitor is powered by the electricity coming from the batteries; to do this we use a dc-dc step-down converter, which drops the voltage low enough to power an Arduino.
Materials/Costs[edit | edit source]
Material costs: Materials for the system of,"WetLand energy monitor" were received by buying new, used, and discounted items. Donated parts where also received. Table below details the materials cost and cost for constructing the WetLand Energy Monitor system.
| Item | Cost [$] | Tax |
|---|---|---|
| Arduino Uno | 25.00 | 1.81 |
| Sensor Shield | 10.88 | 0.79 |
| Real Time Clock | 6.90 | 0.50 |
| RGB LCD | 24.95 | 1.81 |
| Piezo Buzzer | 1.50 | 0.11 |
| (2) Hall Effect Current Sensors | 28.90 | 2.10 |
| DC-DC Step Down Converter | 12.49 | 0.91 |
| SD Shield | 8.99 | 0.65 |
| Mounting Hardware | 3.00 | 0.22 |
| Wires from Battery | 3.99 | 0.29 |
| Wires from Solar Panels | 2.50 | 0.18 |
| Intercept Plug | 3.99 | 0.29 |
| Wood Mounting Surface | Donated | |
| Plexiglass Enclosure | Donated | |
| Misc. Terminals | Donated | |
| Misc. Hardware | Donated | |
| Solder | Donated | |
| Total | 133.09 | 9.65 |
| Final Cost | 142.74 |
Video[edit | edit source]

WetLand energy monitor team[edit | edit source]

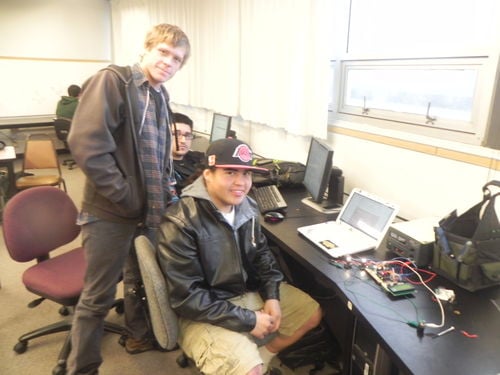
Back to front: Aaron Ayala, Michael Zane Mosby,and Brian-Ismael Vargas Estrada
