This page is the compilation of a rapid research project in partnership between Engr308 Technology and the Environment (taught by Lonny Grafman) and the Cal Poly Humboldt (CPH) Facilities Management during Fall 2022. The client lead on this project is Andrea Alstone, the Energy Manager of CPH Facilities Management.
The course objective of this project is to analyze the embedded CO2e in various types of photovoltaics compared to potential CO2e savings from current gridmix at Cal Poly Humboldt (CPH). This question is prompted by CPH's 2022 Request for Proposals for a 3MW microgrid on campus. Another student objective was to create compelling and related CO2e comparisons for consumers.
Research[edit | edit source]
The following research compares calculates the Embedded CO2e of various panels types based upon a recent (2021) study, the CO2e intensity of the Cal Poly Humboldt current energy grid, the energy production potential of the 3MW array (based upon To Catch the Sun methods), and the potential CO2e offsets of a 3MW microgrid. This culminates in comparing the potential CO2e offsets from the proposed microgrid against the various panel types to calculate the CO2e buyback time in months.
This research is free, open source, and adaptable at https://docs.google.com/spreadsheets/d/1WH9XovvbbvYCipAKgsEgWIDC_OD5-B5rI2btIQIv8uc/edit?usp=sharing.
Embedded CO2e of the panels[edit | edit source]
To determine the embedded CO2e in different panel types, we relied heavily on "A comparative life cycle assessment of silicon PV modules: Impact of module design, manufacturing location and inventory"[1] “This [2021] study closes this research gap by comparing the environmental impacts of sc-Si glass-backsheet [G-BS] and glass-glass [GG] modules produced in China, Germany and the European Union (EU), using current inventory data.”
Scaling the findings of that study with the proposed 3MW system at CPH, we found that the embedded CO2e in the EU G-G panel was 1,389 tons, EU G-BS panel was 1,587 tons, Germany G-G panel was 1,720 tons, Germany G-BS panel was 1,918 tons, China G-G panel was 2,480 tons, and China G-BS panel was 2,679 tons as shown in Table 1.
| Panel type and origin | G-G EU | G-BS EU | G-G Germany | G-BS Germany | G-G China | G-BS China | units |
|---|---|---|---|---|---|---|---|
| Embedded CO2e per peak kW | 420 | 480 | 520 | 580 | 750 | 810 | kg CO2e/kWp |
| Embedded CO2e in proposed array | 1,389 | 1,587 | 1,720 | 1,918 | 2,480 | 2,679 | ton CO2e |
The highest embedded CO2e was in the China G-BS panel with 2,679 tons of embedded CO2e for the 3MW array. The lowest embedded CO2e was in the EU G-G panel with 1,3u9 tons of embedded CO2e for the 3MW array. The system boundary for the embedded embedded CO2e includes production, transportation of materials, and end of life, but does not include the balance of system, installation, nor operation. Therefore these embedded CO2e are sufficient for comparing between systems (which will have similar balance of systems, installations, and operations).
Gridmix CO2e[edit | edit source]
To determine the CO2e of CPH's current grid we used the weighted average of our current gridmix (data sourced from https://reports.aashe.org/institutions/humboldt-state-university-ca/report/2020-05-07/OP/energy/OP-6/) with the average CO2e intensity for each fuel type (most data sourced from https://unece.org/sed/documents/2021/10/reports/life-cycle-assessment-electricity-generation-options). We found that our current grid has a CO2e intensity of 0.343 ton CO2e/MWh as shown in Table 2.
| CSU POWER CONTENT | |||
| from SENA Power Label | 2018 | CO2e intensity | |
|---|---|---|---|
| ENERGY | POWER MIX | per fuel type | |
| RESOURCES | (Actual) | (g CO2e/kWh) | |
| Eligible Renewable | Source (citation) | ||
| -- Biomass & waste | 3.70% | 0 | EIA Biomas |
| -- Geothermal | 3.70% | 2 | |
| -- Eligible hydroelectric | 0.10% | 13 | UNECE LCA 2021 |
| -- Solar | 11.20% | 28 | UNECE LCA 2021 |
| -- Wind | 10.30% | 21 | UNECE LCA 2021 |
| Coal | 0% | 1095 | UNECE LCA 2021 |
| Large Hydroelectric | 16% | 147 | UNECE LCA 2021 |
| Natural Gas | 55% | 513 | UNECE LCA 2021 |
| Nuclear | 0% | 6.4 | UNECE LCA 2021 |
| TOTAL | 100% | 311.1 | g CO2e/kWh |
| Total in tons per MWh | 0.343 | ton CO2e/MWh | |
Energy production and potential avoided CO2e[edit | edit source]
To determine the potential offset CO2e from the grid, we determined the average monthly energy production of the 3MW grid and applied the CO2e intensity of our current grid. Monthly insolation data is from NREL, a conservative 90% was chosen for the balance of system (BOS) efficiency, and average shading of 2% was applied based upon meetings with the client. Table 3 shows the monthly values of energy production and CO2e avoided in tons. The total yearly production was estimated to be over 4,000 MWh and the total yearly CO2e avoided was over 1400 tons.
| Month | Insolation
(hr/day) |
Month Length
(days/month) |
Energy
(MWh) |
Monthly CO2e avoided
(ton CO2e/month) |
|---|---|---|---|---|
| January | 2.893 | 31 | 237.3 | 81.4 |
| February | 3.309 | 28 | 245.2 | 84.1 |
| March | 3.876 | 31 | 317.9 | 109.0 |
| April | 4.664 | 30 | 370.2 | 126.9 |
| May | 5.248 | 31 | 430.5 | 147.6 |
| June | 6.084 | 30 | 482.9 | 165.6 |
| July | 5.212 | 31 | 427.5 | 146.6 |
| August | 4.672 | 31 | 383.2 | 131.4 |
| September | 5.14 | 30 | 408.0 | 139.9 |
| October | 4.249 | 31 | 348.5 | 119.5 |
| November | 3.185 | 30 | 252.8 | 86.7 |
| December | 2.664 | 31 | 218.5 | 74.9 |
| Total | 4122.7 | 1413.6 | ||
CO2e Buyback Time[edit | edit source]
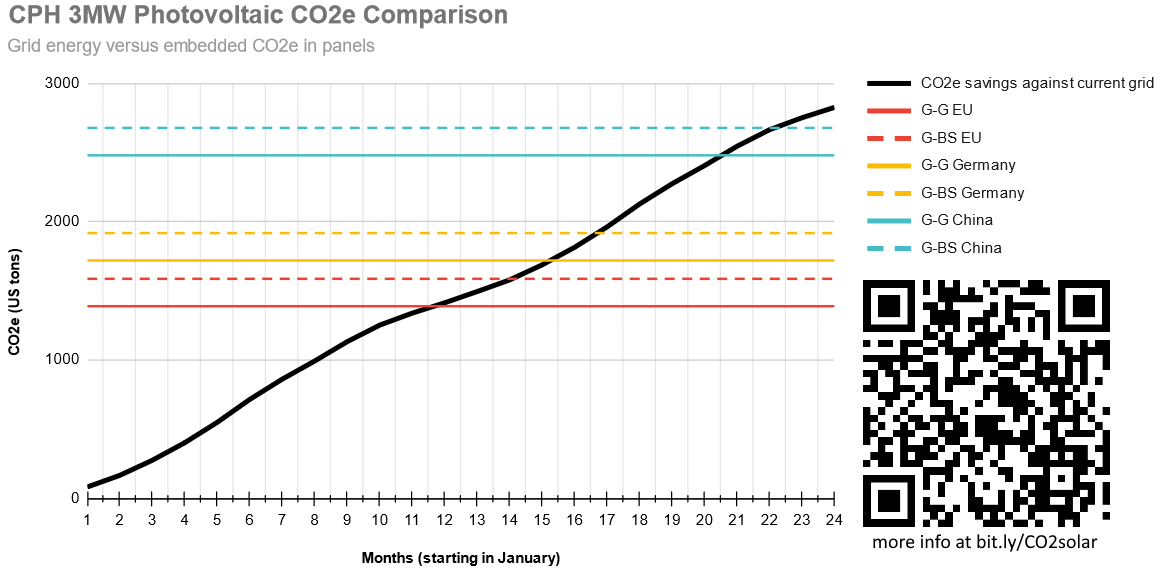
These data were combined to determine how long it would take to buy back the CO2e embedded in various photovoltaic types compared to the current CPH grid. Figure 1 displays these data combined in one image.

This study of Glass-Back sheet (G-BS) and Glass-Glass (G-G) modules from EU, China, and Germany compared two metrics: carbon dioxide emissions and time. It was concluded that the embedded CO2e in the EU G-G panel was 1,389 tons and the buyback period was 11.5 months. The embedded CO2e in the EU G-BS panel was 1,587 tons and the buyback period was 14 months. The embedded CO2e in the Germany G-G panel was 1,720 tons and the buyback period was 15.5 months. The embedded CO2e in the Germany G-BS panel was 1,918 tons and the buyback period was 16.5 months. The embedded CO2ein the China G-G panel was 2,480 tons and the buyback period was 20.5 months. The embedded CO2e in the China G-BS panel was 2,679 tons and the buyback period was 22 months.
| Panel type and origin | G-G EU | G-BS EU | G-G Germany | G-BS Germany | G-G China | G-BS China | units |
|---|---|---|---|---|---|---|---|
| Embedded CO2e in proposed array | 1,389 | 1,587 | 1,720 | 1,918 | 2,480 | 2,679 | ton CO2e |
| CO2e buyback time compared to grid | 11.5 | 14 | 15.5 | 16.5 | 20.5 | 22 | months |
The calculations and assumptions used to calculate these results can be seen in further detail in this spreadsheet - https://docs.google.com/spreadsheets/d/1WH9XovvbbvYCipAKgsEgWIDC_OD5-B5rI2btIQIv8uc/edit?usp=sharing.
This spreadsheet is site-specific but may be used by others interested in performing similar analysis. The user inputs are highlighted in yellow with calculations in white. Similar grid matrix data and panel power information is needed to apply the spreadsheet to different campuses.
Presentation[edit | edit source]
The following slides are from our final presentation to the client: https://docs.google.com/presentation/d/11gYHjBrmQFkhDH26e5PBzdSP02SDJQbHkzOqKovidGo/edit?usp=sharing
Caveats[edit | edit source]
This was a rapid analysis from a general education course. We suggest you use make a copy of the spreadsheet[2] and evaluate it yourself. Below are some aspects to keep in mind:
- We relied on one study for the embedded CO2e in panel types.
- We did not include most embedded CO2e components that are site specific and the same (e.g., getting the panels to Humboldt, site installation, etc.).
- We did not include the Time-Of-Use variability CO2e in our gridmix, which will be quite impactful when using batteries to load shift.
- This did not look at opportunity costs, future value of money, or anything besides a simple carbon dioxide buyback time.
Compelling Comparisons[edit | edit source]
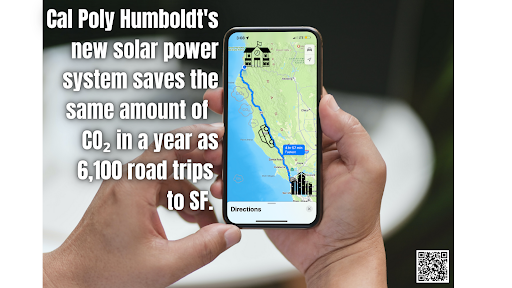
Multiple compelling CO2 comparisons were created by students to appeal to consumers. The following are some examples from students in Engr308 Technology and the Environment during Fall 2022.


- ↑ https://doi.org/10.1016/j.solmat.2021.111277
- ↑ Live view of the google spreadsheet anaylsis - https://docs.google.com/spreadsheets/d/1WH9XovvbbvYCipAKgsEgWIDC_OD5-B5rI2btIQIv8uc/edit?usp=sharing