
The Chromation Spectrometer can be used for applications such as Colorimetric indicator readout, Fluorescence detection, Spectral fingerprinting, Absorption feature analysis, and Spectral activity weighting. This document outlines how to setup and operate the spectrometer on a Raspberry PI and provides some Python code that can be used with the spectrometer. This document also aims to aid others in investigating how to use the spectrometer for other application, one such example is using the spectrometer as an air pollution monitor.
Bill of Materials[edit | edit source]
Chromation Spectrometer, priced at $400 for dev-kit, $150 for the spectrometer, and $200 for the spectrometer mounted on a PCB board. Raspberry PI 3 Model B V1.2 priced at $38.50. SanDisk SD card installed with a version of Raspbian, and 2 USB to Micro USB cords priced at $10.98 and $5.26 respectively. A Pocket Juice Endurance AC portable charger, has an output of 5V/2.4A, 10000mAh, any battery pack that can provide at minimum 3.3V to all the electronics will suffice this was just a convenient option on hand, which is priced at $19.99. The design also has 2 electric wires priced at $11.99 per 120 pcs, and a 390 nm LED priced at $0.99. The final cost comes out to $81.18 without the spectrometer and up to $481.18 with the full dev-kit.
Specifications of the Spectrometer[edit | edit source]
The Chromation Spectrometer can be divided into three printed circuit boards, a vis-analog-out, vis-spi-out, and a usb-bridge. The analog out board directly communicates with the spectrometer chip while the other two interface with the analog-out board to retrieve the data and operate the spectrometer. The spectrometer has a supply voltage range from 0V to 6V, with an operating temperature range between -10oC and 85oC, which means that for most applications the spectrometer is well suited for but it does not operate well in colder environments. Power to all parts can be done with a single +3.3V supply, the ADC voltage reference for the spectrometer is 1.8V and the linear response of the detector is 5% tpo70%. The spectrometer also has dark-correction where the dark signal is split into two components, a DC offset called dark-offset and an AC component called dark noise. Dark offset is reduced by finding the average dark offset on a per-pixel basis then subtracting that from the illuminated measurement. Dark noise is reduced by filtering, which can be done by averaging frames or by using longer exposure times. Dark correction is done because it improves dynamic range of the spectrometer.
Software Used[edit | edit source]
The sensor uses python to run the spectrometer from the Raspberry Pi. The Python repository created by Chromation is located at this link Chromation GUI. However another code and GUI were developed that also use Python. To ensure that the GUI for the spectrometer will work make sure that the latest version of pygame is installed onto the operating system and the code runs best on python version 3.7.3, and to make sure that the PI can connect with the spectrometer, detailed instructions are included in the dev-kit files that can be found at this link [https://tinyurl.com/dev-kit-2020-labview]. Much of this setup involves opening communication between the PI and Spectrometer.
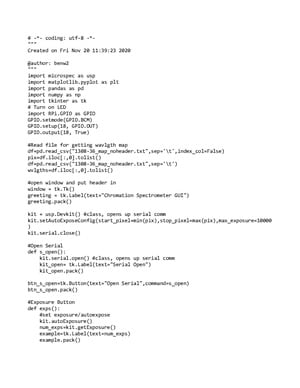
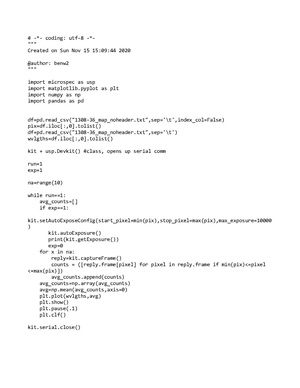
A code to run the spectrometer using the Spyder IDE software for python was developed in large parts thanks to Ben Wiegand. The programs have two types, on a continuous loop which constantly samples and then plots what is detected by the spectrometer and another program which opens up a GUI interface with the spectrometer. The continuous loop program is useful for continuous observations, where change is expected to occur quickly. The GUI is more appropriate for observations where comparisons are desired because multiple observations can be observed and plotted on the same figure. The GUI includes several prompts, Open Serial, Auto Expose, Enter Number of Averages, Start, and Close Serial. The open serial button when clicked simply connects to the spectrometer, the auto expose uses a function of the spectrometer to set the exposure time and is longer the more dim the light source is, 200 ms is the longest exposure time. The Number of Averages modifies how many times the data is collected and averaged before generating the plot, while start actually begins data collection. The Close Serial button needs to be clicked before the GUI is closed otherwise the code encounters problems when it is run again since the serial will still be open but the program will not connect to the spectrometer.
Another software that was used is OS Real VNC Server that was installed on the Raspberry PI and Real VNC Viewer which was installed on a Samsung Galaxy S9. This is only useful if the intended application is to create of portable device. This allows for operation of the spectrometer from a device such as a phone or tablet making the device portable. A limitation of this is that to connect to the Real VNC Server then the PI needs to powered on and logged into otherwise the server is not available.
Why Air Pollution[edit | edit source]
Urban air pollution is a severe factor for human health especially in major cities around the world (Zelinger et-el, 2006). Urban air pollution can lead to health issues like irritation of skin or other organs and can also contribute to causes for death (Ezzati et al., 2004). This pollution is composed of many different substances of varying degree of toxicity, one of the common components to be measured is particulate matter ( US EPA, OAR, 2016). Particulate matter can be divided to categories depending on the diameter of the particle, the two most common divisions are 10 and 2.5 μm (Ezzati et al., 2004). Urban air pollution measured in PM contributes to 3% of mortality of cardiopulmonary disease in adults, about 5% of mortality attributable to cancers such as lung cancer and 1% of mortality in children with acute respiratory illnesses (Ezzati et al., 2004). Estimated annual concentrations of PM2.5 30 μg/m3 within cities in North America and Western Europe with concentrations greater then that in developing countries (Ezzati et-al., 2004). For reference the annual concentrations of PM2.5 recommended by the National Ambient Air Quality Standards developed by the United States Environmental Protection Agency are 12.0 μg/m3 measured at the source, and 15.0 μg/m3 from reaction in the air (US EPA, OAR, 2014), which are smaller then the value measured by Ezzati et-al.
Several methods can be used to monitor air pollution. (brief lit review- big paper for each major type) Commercial air pollution monitors exist, some share others’ data- but are either not in the control of the user unacceptable for science, advantages of open source/advantages of using a spectrometer…..other OS spectrometers….. One method to monitor air pollution is to use laser remote sensing (Zelinger et-al, 2004). One of the techniques is differential absorption LIDAR (DIAL), which can construct two or three dimensional profiles of pollutants concentrations at large distances (Zelinger et-al, 2004). This technique can then be used to construct vertical profiles of the pollutants in real atmospheric settings allowing for modeling of distribution and movement from sources of pollution (. Another is to use spectroscopy to collect air pollution data (Zelinger et-el, 2004). Spectroscopy can take the form of many different methods and most studies focus around specific categories of wavelengths. Infrared spectroscopy is popular in aerosol studies because breaks within the absorption lines of CO2 and H2O correlate with spectra of pollutants (Hanst et-al, 1978). One of the issues of using remote sensing to measure air pollution is the interaction of atmospheric particles with light often resulting in scattering such a Mie scattering. Mie Scattering is when atmospheric particles of similar diameter to light wavelengths interact with light causing refractions and reflections, these particles are commonly dust, water droplets, smoke, and pollen. There are different properties that effect this scattering such as concentration, particle size, particle shape, refractive index, and absorption index, however the most important part of air pollution is the concentration so by taking into account the scattering effects of the particles then a measurement of air pollution can be performed (Sinclair, 1953). Additionally another form of Scattering is Rayleigh scattering, which is when particles that are smaller then a wavelength cause scattering of the light. This mechanism is what causes the sky to be blue since UV and blue wavelengths of light from the sun scatter in the upper atmosphere and diffusing out so that blue light is detected as a background (Rayleigh Scattering, 2020).
There is a need for a low-cost open source air pollution remote sensor. One solution for a portable air quality monitoring device is a portable gas chromatograph (Marć et-el, 2015), . These instruments also require methods of sampling the air either in a chamber or without. Some drawbacks of using gas chromatographs and other portable monitoring devices is that they have lows sensitivity and low separation efficiency (Marć et-al, 2015). Portable spectrometers are also expensive, one such commercially available unit is priced at $259.99 for the Temtop M2000 2nd air Quality Monitor. The device can measure HCHO, PM10, PM2.5, CO2, temperature, and, humidity. The temtop can also graph the values of the measured pollutants in real time (Temptop M2000, 2020). Another air quality measuring device is a Spectrophotometer, which can be both portable and not. Spectrophotometers can be used to find absorbance and conduct experiments involving Beer’s Law. An example of such a device that is on the market is the SP-V1000 spectrophotometer, made by scilogex. This device has a range of wavelength detection from 325 nm to 1000 nm and costs $1428.00 (Spectrophotometer SP-V1000, 2020). That is expensive so a lower cost alternative that can be developed by open source methodology is needed.
The Chromation Spectrometer could be made into either an optical sensor or a spectrophotometer for air pollution purposes. The paper by Laganovska et-al is a document that lays out how to build and validate a spectrophotometer and would be a useful starting point for similar projects. This document also includes some references on how to adapt the Chromation Spectrometer for air pollution monitoring
Sample Validation Study[edit | edit source]
The validation experiment for the spectrometer will be a side by side comparison of with another spectrometer in order to determine which has better detection of particulate matter. To conduct the validation experiment an air tight box made from acrylic glass can be made with several holes drilled into the sides for electric wires and sampling purposes. Particles will be introduced into the chamber and to determine concentration measure with a device of known accuracy and reliability. Once the chamber is saturated with particles at the upper detection limit of the devices then stop the particle flow and allow random diffusion to evenly distribute the particles. Particles will settle out of the air so continuously measure the concentration at a set time interval. Performance aspects that will be examined are linearity of response, precision of measurement, limit of detection, dependence on particle composition, and dependence on particle size. Options to asses the linearity are the least-square regression and the reduced major axis regression, the precision is related to accuracy and repeatability and accuracy is determined from the known device. Limit of detection is the lowest significant deviation from blank readings. Particle size and composition effect scattering due to refractive index that changes due to the composition and size effects Rayleigh and Mie methods (Wang et-al, 2015). Particles that can be used for this study can be generated by burning incense which is an important source of indoor aerosols (Cheng et-el 1995)
3D Printable Design[edit | edit source]
These are some models made un Opens CAD that can be used a base to start containing the spectrometer and other components for the portable design. Depending on weatherproofing then class could be added to the aperture during printing to create a weatherproof design.


See also[edit | edit source]
References[edit | edit source]
Cheng, Y. S., Bechtold, W. E., Yu, C. C., and Hung, I. F. (1995). Incense Smoke: Characterization and Dynamics in Indoor Environments. Aerosol Sci. Tech., 23(3):271–281.
Ezzati, Majid, Alan D. Lopez, Anthony Rodgers, and Christopher J. L. Murray. Comparative Quantification of Health Risks: Global and Regional Burden of Disease Attributable to Selected Major Risk Factors. Geneva: World Health Organization, 2004.
Hagler, G., P. Solomon, AND S. Hunt. 2013 EPA Air Sensors Workshop: New Technology for Low-Cost, Real-Time Air Monitoring. EM: AIR AND WASTE MANAGEMENT ASSOCIATION'S MAGAZINE FOR ENVIRONMENTAL MANAGERS. Air & Waste Management Association, Pittsburgh, PA, (January):6-9, (2014)
Hanst, Philip L. "Air Pollution Measurement by Fourier Transform Spectroscopy." Applied Optics 17, no. 9 (1978): 1360–1366.
Laganovska, Katrina, Aleksejs Zolotarjovs, Mercedes Vázquez, Kirsty Mc Donnell, Janis Liepins, Hadar Ben-Yoav, Varis Karitans, and Krisjanis Smits. "Portable Low-Cost Open-Source Wireless Spectrophotometer for Fast and Reliable Measurements." HardwareX 7 (April 1, 2020): e00108. https://doi.org/10.1016/j.ohx.2020.e00108.
Marć, Mariusz, Marek Tobiszewski, Bożena Zabiegała, Miguel de la Guardia, and Jacek Namieśnik. "Current Air Quality Analytics and Monitoring: A Review." Analytica Chimica Acta 853 (January 1, 2015): 116–26. https://doi.org/10.1016/j.aca.2014.10.018.
"Rayleigh Scattering." In Wikipedia, November 27, 2020. https://en.wikipedia.org/w/index.php?title=Rayleigh_scattering&oldid=990998587. Sinclair, David. "Light Scattering Instruments as an Aid in Air Pollution Measurements." Air Repair 3, no. 1 (August 1953): 51–56. https://doi.org/10.1080/00966665.1953.10467591.
"Spectrophotometer SP-V1000, 325~1000nm, with Tungsten Lamp, 4 Glass Square Cuvettes, USA Plug, 110/220 V, 50/60 Hz, 80 W." Accessed December 2, 2020. https://www.southernlabware.com/spectrophotometer-sp-v1000-325-1000nm-with-tungsten-lamp-4-glass-square-cuvettes-usa-plug-110-220-v-50-60-hz-80-w.html.
"Temtop M2000 2nd Air Quality Monitor for CO2 PM2.5 PM10 Particles HCHO – Elitech Technology, Inc." Accessed December 2, 2020. https://www.elitechustore.com/products/temtop-m2000-2nd-generation-air-quality-monitor-for-pm2-5-pm10-particles-co2-hcho-temperature-humidity-settable-audio-alarm-data-export-recording-curve-easy-calibration?utm_medium=cpc&utm_source=google&utm_campaign=Google%20Shopping&gclid=CjwKCAjw0On8BRAgEiwAincsHK_gBroAdDEizY-mkGI2AiVvxJhyK9Qnzo7C_qJZhE1GpdWrNEZgERoCorMQAvD_BwE
US EPA, OAR. "NAAQS Table." Other Policies and Guidance. US EPA, April 10, 2014. https://www.epa.gov/criteria-air-pollutants/naaqs-table.
US EPA, OAR. "Air Quality - National Summary." Data and Tools. US EPA, May 4, 2016. https://www.epa.gov/air-trends/air-quality-national-summary.
Wang, Yang, Jiayu Li, He Jing, Qiang Zhang, Jingkun Jiang, and Pratim Biswas. "Laboratory Evaluation and Calibration of Three Low-Cost Particle Sensors for Particulate Matter Measurement." Aerosol Science and Technology 49, no. 11 (November 2, 2015): 1063–77. https://doi.org/10.1080/02786826.2015.1100710.
Zelinger, Z., M. Střižı́k, P. Kubát, Z. Jaňour, P. Berger, A. Černỳ, and P. Engst. "Laser Remote Sensing and Photoacoustic Spectrometry Applied in Air Pollution Investigation." Optics and Lasers in Engineering 42, no. 4 (2004): 403–412.
Zelinger, Zdeněk, Pavel Kubát, Michal Střižík, Klára Bezpalcová, Zbyněk Jaňour, Pavel Danihelka, Sylva Drábková, Milada Kozubková, Pavel Berger, and Alexandr Černỳ. "Urban Air Pollution and Its Photochemistry Studied by Laser Spectroscopic Methods." In Remote Sensing of the Atmosphere for Environmental Security, 301–316. Springer, 2006.