No higher resolution available.
Illustration_of_Real-Time_Display.png (353 × 520 pixels, file size: 224 KB, MIME type: image/png)
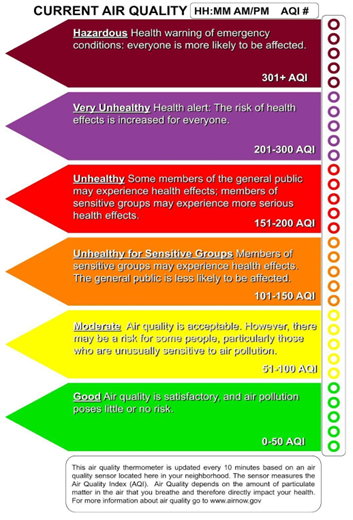
The LED strip on the right illuminates as the AQI value increases. The interpretive sign on the left indicates the AQI thresholds for public health, and sourced from the US Environmental Protection Agency (EPA) guidelines. At the top is the actually AQI value and the time it was measured.
File history
Click on a date/time to view the file as it appeared at that time.
| Date/Time | Thumbnail | Dimensions | User | Comment | |
|---|---|---|---|---|---|
| current | 17:47, 10 May 2023 | | 353 × 520 (224 KB) | Clarkemstevenson (talk | contribs) |
You cannot overwrite this file.
File usage
The following page uses this file: