Objective[edit | edit source]

A PurpleAir sensor network has been set up in Orleans to monitor and communicate potentially dangerous thresholds of air quality. However, with Purple Air devices utilizing a web-based interface, not all community members have easy access to air quality information. They may not be familiar with the internet and/ or the Purple Air database. By developing more effective ways of communicating important air quality thresholds, the community may be able to make more informed decisions about their health.
The goal of this project is to more clearly communicate the real-time air quality to the town of Orleans. The objective is to build a real-time air quality display system resilient to power outages and inconsistent WiFi.
Product Description[edit | edit source]
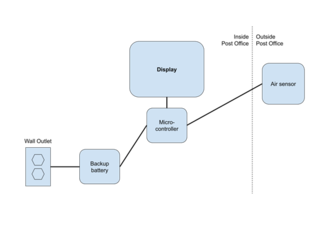
This prototype displays outdoor air quality in a public space, while providing security and protection from the elements. We selected a design in which the display, microcontroller and battery are located inside and the air sensor is placed outside. This design was created to satisfy the requirements of CalPoly Humboldt Engineering 535 class. See Figure 2 for a schematic of the system.
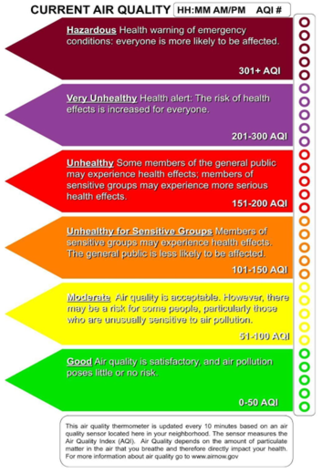
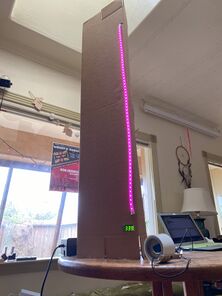
The display features a LED strip which incrementally lights up and changes colors according to the air quality thresholds as the Air Quality Index (AQI) value increases. Next to the LED strip there is an interpretive sign which provides information on what the lights mean, the air quality thresholds, and where one would be able to go to get more information. Additionally, a LED display is also incorporated into the system which displays the real time AQI value. We recommend that the system should also display the time at which the AQI value was measured, although it is not included in the current design. Figure 3 shows what the display would look like.
The final design is the development-level prototype that will be useful for others to build upon to make a more robust and manufacturable product. The prototype effectively displays real-time air quality data using the chosen components and displays the data on a cardboard cutout display. The final design departs from the PurpleAir II product, however, it uses the same PM2.5 air quality sensor component and the same brand of microcontroller unit (ESP32) as the PurpleAir sensors. It utilizes a breadboard to connect a LED strip display, a number display, an air sensor and the ESP32 microcontroller. The LED strip has 60 lights, ten for each air quality threshold. When the air quality increases, lights fill each category and change colors when AQI levels enter into a new index level. There is an interpretive illustration shown in Figure 2, which describes the number range and hazard as described by the EPA. Figures 9 and 10 show a mock up version of what the display could look like.
Component Selection[edit | edit source]
The main components of the project and their prices from the Adafruit website are listed in Table 1. The main components could be swapped with alternatives but it would require confirmation that power and data capabilities are met. For example, the 7-segment display is only 0.56 inches tall and could be swapped with a larger numerical display using the same power and data transmission methods but the power consumption may be different and require resizing of the battery.
Table 1: Main Components List
| Component Description | Link | Cost |
|---|---|---|
| PM2.5 Air Quality Sensor with Breadboard Adapter, by Plantower | https://www.adafruit.com/product/3686 | $39.95 |
| Assembled Adafruit 0.56" 4-Digit 7-Segment Display - w/ I2C Backpack QT - Green | https://www.adafruit.com/product/5603 | $13.95 |
| NeoPixel Digital RGBW 1m LED Strip - White PCB 60 LED/m | https://www.adafruit.com/product/2846 | $26.95 |
| HUZZAH32 – ESP32 Feather Board (pre-soldered) | https://www.adafruit.com/product/3591 | $20.95 |
| UPS 600VA 360W Surge Protector Battery Power Backup * | Surge protector with UPS battery backup | $74.77 |
* We do not recommend using the UPS backup battery, though we used it for our prototype
We also used a variety of prototyping materials (Table 2) that are likely found in most makers spaces or electronics shops. These parts were necessary for the prototype but the exact brand or vendor are not necessary and we recommend using recycled equipment if available. We included the links we used to purchase these minor parts if purchasing is needed.
Table 2: Minor Parts
| Part Description | Link |
|---|---|
| Micro USB Cable (supporting data and charging) | Micro USB Cables on Amazon |
| USB Wall Charger - 1A 5V Plug Power Adapter | 5V USB Wall Charger Block on Amazon |
| 5V 2A (2000mA) power chord for LED lgihts | 5V 2A power cord from Adafruit |
| 400 Pin (or larger) Solderless Bread Board | Breadboards on Amazon |
| Jumper Wires (both male-male and male-female) | Jumper Wire from DigiKey |
| Female DC Power adapter - 2.1mm jack to screw terminal block | Female Power Adapter from Adafruit |
| Resistors: (2) 300-500 ohm resistor, (1) 1800 ohm resistor | Pack of Resistors from Amazon |
We have also formulated a list of parts that we suggest acquiring for an improved system but that we did not incorporate into our prototype version, shown in Table 3.
Table 3: Suggested parts
| Component | Possible Source |
|---|---|
| Lithium Ion battery pack for connection to Microcontroller battery port* | 24 wh Li-Ion Battery Pack |
| Battery back-up alternative for connection to the microcontroller via USB* | GoSun Solar Battery Bank (144Wh) |
| 1000uf capacitor for LEDs | 20 capacitors from Amazon |
| Printed Acrylic Sign | Acrylic sign from Signs.com |
* The battery backup we used was only able to power the system for 3 hours and 40 minutes under poor air quality conditions (all lights on) and the UPS system beeped the whole time. Instead we recommend a Lithium Ion battery pack to connect directly to the battery port on the microcontroller or a battery backup for designed for continuous use. More research and testing is required to better size a battery for this system.
Prototype Construction[edit | edit source]
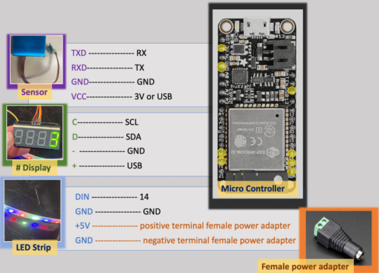
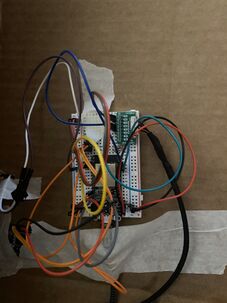
To construct the prototype, the sensor, number display and LED strip were connected to a microcontroller via jumper cables and a breadboard. Power was supplied to the microcontroller-number display-sensor portion of the system via a USB cable and a separate power cord was used to power the colored LED strip. The instructions will enable another developer to recreate this prototype and further develop the product into a deployable system. The connections mechanisms are purposefully vague as we expect the next developer to try this first using jumper cables and a breadboard and then by soldering or designing a custom breakout board. Highlighted are changes we would make on a second version.
All connections between the major components (Table 1) are shown in the schematic in Figure 4.
Assembly Video Instruction[edit | edit source]
The
Step-by-step instructions[edit | edit source]
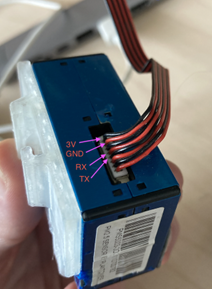
The sensor wires requiring connection are TXD, RXD, GND and VCC. Connect the sensor TXD wire to the microcontroller RX pin, the sensor RXD wire to the microcontroller TX pin (these are intentionally opposites), the sensor GND wire to the microcontroller GND pin and the sensor VCC wire to the microcontroller 3V or USB pins. The sensor works with either a 3V or a 5V power supply. The sensor wires are labeled on the breakout board or, if using a older/recycled sensor, the wires are labeled below and can be found on the manufacturer’s website. We elongated the cord between the sensor and the microcontroller by soldering each of the required wires to wires in an old USB cable, this could be done other ways and a pre-manufactured longer cord may be available online.
The 7-segment number display pins requiring connection are C, D, -, and +. Connect the display C pin to the microcontroller SCL pin and the display D pin to the microcontroller SDA pin. These are the clock I2C and data I2C pins. I2C is a communication protocol. In order the I2C communication to work for the specific microcontroller, 300-500 ohm resistors are needed to connect the microcontroller SCL and SDA pins with a 3V power supply.
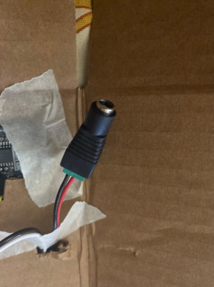
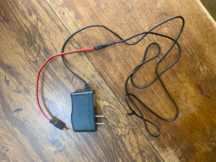
Connect the “+” and “-” wires from the bottom end of the LED strip to a Female DC Power adapter (2.1mm jack to screw terminal block). Note that both sides of the LED strip look the same but there are arrows showing which way power and data are transmitted through the strip, the bottom is the direction opposite the arrows. Connect the female power adapter to a 5V 2A (2000mA) power chord with a male 2.1mm jack end. Plug into a 120V (standard wall) power source.
Notes:
- The LEDs should always be plugged in before the microcontroller, otherwise the LEDs will try to draw power through the microcontroller.
- Plugging in the LED strip will not turn it on, the strip needs communication from the microcontroller to tell it which lights to turn on, how bright and what color.
- Suggested Upgrade: The LED lights likely could be powered through the microcontroller, especially if the brightness was lowered. This would enable the whole system to only require one wall plug and would reduce likelihood of plugging in the components in the wrong order and possibly damaging the microcontroller.
- Suggested Upgrade: The manufacturer recommends a 1000uF capacitor attached the positive and negative terminals of the power adapter. We skipped this but it should be added to protect possible damage to the LEDs.
The LED strip’s DIN pin requires connection to any data pin on the microcontroller. We chose to use data pin 14. A 1800 ohm resistor is required inline between the LED DIN pin and the microcontroller data pin. Note: If using an alternate data pin, the code provided for the microcontroller would need to be updated.
Connect the microcontroller to your computer using the micro USB cable. Download and open the Arduino IDE application. Install the following libraries: Adafruit_PM25AQI, Adafruit_NeoPixel, Adafruit_GFX, Adafruit_LEDBackpack. Select the board that corresponds to the microcontroller make and model. Select the connected usb cable as the port. Insert the code found in Appendix A and upload it to the microcontroller. Adjust the baud rate to 9600. In the serial monitor the code should show “PM25 sensor found!” and then and then “pm25 reading success” on repeat as it loops to take continuous AQI readings. Disconnect the board from the computer. The board will now re-run the loop in the code whenever it is powered.
Connect the USB cord from microcontroller to a 5V power adapter block and to a 120V (regular wall plug) power source. Select the microcontroller being used as the board and the connected USB as the port.
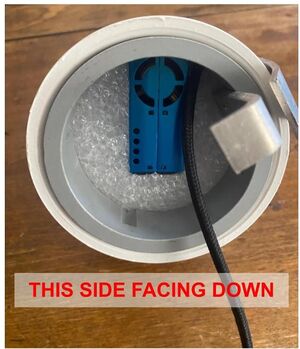
We used a 2-inch PVC cap adapted from an old PurpleAir device and used packing foam to stabilize the sensor inside.
We did not enclose the electronics, as this was only a proof-of-concept prototype but we recommend housing the microcontroller in a protective container to make it more sleek and robust.
Operating Cost[edit | edit source]
The installation location will be a public building such as a local office or community center. Therefore, we opted to assume “B-1” as an appropriate PG&E electric tariff. The maximum cost per kWh under B-1 is $0.41383. Under worst case conditions (i.e. manufacture specs for lighting up the whole display with white light and no microcontroller sleeping) the system uses about 138 watts. When testing the system by plugging into a wall-plug-meter under elevated AQI conditions, however, we observed less than 6 watts (5.72 watts) consumed, even during hazardous air quality (when all of the LED lights were on). We considered the tested value more representative of real power consumption during poor air quality conditions. Using tested worst case power consumption and the maximum rate in the B-1 tariff structure, the maximum cost to operate the Real-Time Display $0.057 per day assuming air quality remained poor for the full 24 hour day.
Power Requirements and Battery Sizing[edit | edit source]
The power usage of the system was tested using an in-line power meter and the results are shown in Table 4. Under poor air quality conditions, when we assume the highest power consumption (because all lights are on), the system used less than 6 watts.
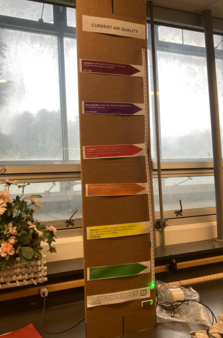
Table 4: Power consumption under different air quality scenarios.
| Trial | Air Quality Level | Power Consumption (watts) |
|---|---|---|
| 1 | Hazardous | 5.72 |
| 2 | Good | 1.08 |
Therefore, to provide 24 hours of autonomy, we suggest incorporating a 144wh battery (6w x 24h) to the system. A 5V battery could be incorporated to the “BAT” pin on the microcontroller which allows the battery to charge when the microcontroller USB is plugged into a power source and the microcontroller to use power from the battery when USB power is unavailable. This would require testing to be sure that all components are provided with sufficient power when USB power is disconnected.
Future Development Recommendations[edit | edit source]
For the prototype project, some considerations were identified to inform future development recommendations.
Wire wrapping[edit | edit source]
The real-time air quality display utilizes a development breadboard and jumper cables to transmit data and power between the microcontroller and the air sensor, LED lights and seven-segment display. This method is typically used for development of a product but not for the final product as the breadboard and jumper cables are fragile and bulky. We recommend designing a custom PCB or simply wire wrapping the connections to make the product more robust and sleek.
Battery[edit | edit source]
In an attempt to meet the client needs of resilience to power outages, we included a UPS backup battery that the two AC power adapter plugs associated with the display plug into. However, with some testing of this system, we found that the UPS battery backup can only power the system for approximately 3.5 hours in poor air quality and the UPS system beeps continuously when unplugged from a power source. We recommend replacing the UPS battery backup with a battery connected directly to the microcontroller which would avoid the beeping nuisance and would increase energy efficiency since power would not need to be converted from AC to DC twice (as is the case with the UPS system).
Display Measurement Timing[edit | edit source]
We recommend adding a method to display the time at which the air quality reading was collected to verify continuous air quality sampling. This could be a timestamp displayed on the seven-segment display or a second seven-segment display. Alternatively, the Arduino code could be updated to show an error message on the seven-segment display and perhaps blinking lights to indicate problems occurring.
How to install[edit | edit source]
There are four main components to install for the Real Time Air Quality Display: air sensor, display, micro-controller, and battery. These components should be installed in two stages: indoor and outdoor installation. Figure 2 shows where system components should be located. The following steps will outline how to complete both the indoor and outdoor installation.
Installation Video[edit | edit source]
Outdoor Installation[edit | edit source]
The air sensor must be installed outside to create accurate air quality readings. The air sensor is protected from the elements by the provided exterior cover.
- Identify an ideal location for the air sensor. It should fulfill the following requirements:
- Free air flow, preferably 180° open radius
- Away from direct pollutant sources such as exhaust, smoking etc.
- Within 12 ft’ of an indoor power source
- A usable surface for attachment
- Preferably out of direct reach to reduce the chances of tamper
- Orient the air sensor so that the open end of the cover is facing down.
- Using the provided brackets and/or zip tie, attach the air sensor to the chosen location.
- The other components will be placed indoors so the 12 ft cord connecting the air sensor to the microcontroller should be able to reach from the air sensor to an indoor location as well.
Indoor Installation[edit | edit source]
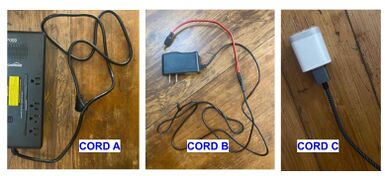
The other components are not weather protected so housing them indoor is important for safety as well as longevity of the system. Figure 11 depicts the appropriate cords needed.
- Plug the backup battery pack into a wall outlet using cord A to allow the battery to charge. 8 hours is optimal for a full charge but the system will still work without a fully charged battery if grid power is being supplied via a wall outlet.
- Identify an indoor location. It should fulfill the following requirements:
- Within 12 ft’ of the air sensor installed outdoors
- Near an outlet/ power source
- Near a window the display can be seen from
- Using the provided poster tape, attach the display to the window so the display is visible from the exterior.
- Plug the battery into the nearby outlet using cord A
- Plug the LED power cord, cord B, into the base of the LED lights and then into battery. Use the sockets labeled battery backup and surge protection.
- Plug the remaining data cord, cord C which is already connected to the microcontroller into the battery. Use the sockets labeled battery backup and surge protection.
How to use[edit | edit source]
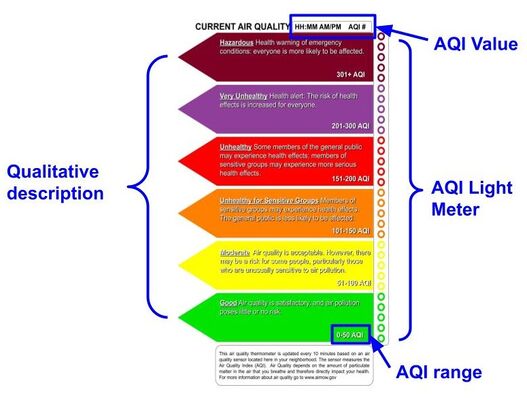
Once the system is fully installed, press and hold the power button on the backup battery pack for approximately 2 seconds. The backup battery pack will beep and the power button should light up green. At this point the real time display should automatically start collecting and displaying air quality data. This may take up to a minute for the system to begin displaying. Once the system has begun to display real time data, it will update the displayed data every 10 seconds. The display as illustrated in Figure 12 will communicate the following information:
The AQI value: This is current air quality in terms of the Air Quality Index (AQI). This is displayed in the bottom right corner of the display. The display further notes AQI ranges associated with “good” or “bad” air quality.
AQI light meter: This visually communicates the current air quality. The lights are lit up to the corresponding AQI value. Each lit light represents approximately 5 AQI. The lights are color coded to further communicate how “good” or “bad” the air quality is. The left-hand display notes each color, the qualitative description of the air quality as well as the numerical AQI range it represents.
Overall “good” air quality is represented by lower AQI values and “Bad” air quality is represented by higher AQI values. Green, yellow, orange, red, purple and maroon denote “good” to “bad” air quality. Figure 2 shows what the installed system looks like to users.
Operations and Maintenance[edit | edit source]
This system is powered primarily via grid power from a standard outlet. Therefore, there is minimal maintenance needed. System components such as the battery and LED lights may need to be replaced at the end of life. These components are meant to have a long lifetime, therefore the original system should last several years before component replacements are required.
Use of the battery system can impact the lifetime of this component. The frequency of grid outages will impact the overall use and lifetime of the battery. Also, additional loads should not be plugged into the battery pack. This will reduce the amount of time the display system can run during a grid outage.
The air sensor should be installed so the opening in the covering is facing downward. Installation under a building overhang or porch can provide additional protection. Failure to do so could result in system failure. Figure 12 demonstrates the proper installation of the sensor into a weather proof covering.
Users should take standard precautions when handling electrical appliances. If handling or modifying the microcontroller, unplug all cords (A, B and C). Exposure of indoor components to water or weather could result in safety concerns and/ or system failure as the indoor components are electrically powered not rated for outdoor use.
If a component replacement is required, refer to the parts list for the proper replacement component and the construction manual for proper installation of the replacement component.
Operation During Grid Outage[edit | edit source]
During a grid outage the back up battery will automatically begin to supply power to the real time display. The battery will notify you it is supplying power by beeping approximately every minute. A fully charged battery can provide power to the real time display for up to 19 hours and 45 minutes. This length of battery power can be achieved by unplugging the LED lights, or cord B, from the backup battery. In this scenario, the AQI value will still be displayed and update regularly but the LED lights will no be lit. If the LED light remain plugged into the back up battery, battery life during a grid outage will vary based on the lights lit. The number and color of lights impact the battery life. The minimum battery life is 3 hours and 40 minutes.
References[edit | edit source]
- ATMO. (n.d.). Particulate Matter (PM) levels and AQI. ATMO. https://atmotube.com/atmotube-support/particulate-matter-pm-levels-and-aqi
- Barnatt, C. (n.d.). Single Board Computer. Explaining Computers. https://www.explainingcomputers.com/sbc.html
- CARB. (n.d.). Protecting Yourself from Wildfire Smoke. CARB. https://ww2.arb.ca.gov/protecting-yourself-wildfire-smoke
- Dejan. (n.d.). DIY Air Quality Monitor – PM2.5, CO2, VOC, Ozone, Temp & Hum Arduino Meter. How to Mechatronics. https://howtomechatronics.com/projects/diy-air-quality-monitor-pm2-5-co2-voc-ozone-temp-hum-arduino-meter/
- Humboldt County. (n.d.). Orleans. Humboldt County. https://humboldtgov.org/735/Orleans
- IQAir. (2022). World Air Quality Report. Greenpeace. Retrieved April 4, 2023, from https://www.greenpeace.org/static/planet4-india-stateless/2023/03/2fe33d7a-2022-world-air-quality-report.pdf
- LAO. (2022, November 14). Understanding the Challenges Posed by Wildfire Smoke in California. Legislative Analyst's Office. Retrieved April 8, 2023, from https://lao.ca.gov/Publications/Report/4644#:~:text=As%20a%20point%20of%20comparison,5%20annually.
- Lutkevich, B. (n.d.). Microcontroller. TechTarget. https://www.techtarget.com/iotagenda/definition/microcontroller
- SciJinks. (n.d.). How Is Air Quality Measured? SciJinks. https://scijinks.gov/air-quality/
- Teja, R. (2021, April 5). What are the Differences Between Raspberry Pi and Arduino? Electronics Hub. https://www.electronicshub.org/raspberry-pi-vs-arduino/
- U.S EPA. (n.d.). Air Quality - National Summary. U.S EPA. https://www.epa.gov/air-trends/air-quality-national-summary#air-quality-trends
- U.S EPA. (2022, July 18). Particulate Matter (PM) Basics. EPA. https://www.epa.gov/pm-pollution/particulate-matter-pm-basics#PM
- U.S EPA. (2022, September). The Enhanced Air Sensor Guidebook. United States Environmental Protection Agency. file:///Users/ns232/Downloads/ENHANCED%20AIR%20SENSOR%20GUIDEBOOK.PDF
APPENDIX A: ARDUINO IDE CODE[edit | edit source]
//SENSOR DATA
/* Test sketch for Adafruit PM2.5 sensor with UART or I2C */
#include "Adafruit_PM25AQI.h"
// If your PM2.5 is UART only, for UNO and others (without hardware serial)
// we must use software serial...
// pin #2 is IN from sensor (TX pin on sensor), leave pin #3 disconnected
// comment these two lines if using hardware serial
//#include <SoftwareSerial.h>
//SoftwareSerial pmSerial(2, 3);
Adafruit_PM25AQI aqi = Adafruit_PM25AQI();
//libraries and variables from seven segment:------------------------
#include <Wire.h> // Enable this line if using Arduino Uno, Mega, etc.
#include <Adafruit_GFX.h>
#include "Adafruit_LEDBackpack.h"
Adafruit_7segment matrix = Adafruit_7segment();
//libraries and variables from LED Strip:------------------------
#include <Adafruit_NeoPixel.h>
#ifdef __AVR__
#include <avr/power.h> // Required for 16 MHz Adafruit Trinket
#endif
// Which pin on the Arduino is connected to the NeoPixels?
// On a Trinket or Gemma we suggest changing this to 1:
#define LED_PIN 14
// How many NeoPixels are attached to the Arduino?
//#define NUMPIXELS 60
#define LED_COUNT 60
//define strip and pixels
Adafruit_NeoPixel pixels(LED_COUNT, LED_PIN, NEO_RGBW + NEO_KHZ800);
//#include <FastLED.h>
//#define NUM_LEDS 18
#define BRIGHTNESS 100
#define LED_TYPE Neopixel
#define COLOR_ORDER RGB
//CRGB leds[NUM_LEDS];
// Declare our NeoPixel strip object:
Adafruit_NeoPixel strip (LED_COUNT, LED_PIN, NEO_RGBW + NEO_KHZ800);
// Argument 1 = Number of pixels in NeoPixel strip
// Argument 2 = Arduino pin number (most are valid)
// Argument 3 = Pixel type flags, add together as needed:
// NEO_KHZ800 800 KHz bitstream (most NeoPixel products w/WS2812 LEDs)
// NEO_KHZ400 400 KHz (classic 'v1' (not v2) FLORA pixels, WS2811 drivers)
// NEO_GRB Pixels are wired for GRB bitstream (most NeoPixel products)
// NEO_RGB Pixels are wired for RGB bitstream (v1 FLORA pixels, not v2)
// NEO_RGBW Pixels are wired for RGBW bitstream (NeoPixel RGBW products)
void setup() {
//SENSOR SETUP ------------------------------------
// Wait for serial monitor to open
Serial.begin(115200);
while (!Serial) delay(10);
Serial.println("Adafruit PMSA003I Air Quality Sensor");
// Wait one second for sensor to boot up!
delay(1000);
// If using serial, initialize it and set baudrate before starting!
// Uncomment one of the following
Serial1.begin(9600);
//pmSerial.begin(9600);
// There are 3 options for connectivity!
//if (! aqi.begin_I2C()) { // connect to the sensor over I2C
if (! aqi.begin_UART(&Serial1)) { // connect to the sensor over hardware serial
//if (! aqi.begin_UART(&pmSerial)) { // connect to the sensor over software serial
Serial.println("Could not find PM 2.5 sensor!");
while (1) delay(10);
}
Serial.println("PM25 sensor found!");
//SEVEN SEGMENT SETUP----------------------------------
#ifndef __AVR_ATtiny85__
Serial.begin(9600);
Serial.println("7 Segment Backpack Test");
Serial.println(SDA);
Serial.println(SCL);
#endif
matrix.begin(0x70);
//LED pixel setup
pixels.begin(); // INITIALIZE NeoPixel strip object (REQUIRED)
strip.begin();
}
// loop() function -- runs repeatedly as long as board is on ---------------
void loop() {
//collect/readout AQI Data
PM25_AQI_Data data;
if (! aqi.read(&data)) {
Serial.println("Could not read pm25");
delay(500); // try again in a bit!
return;
}
Serial.println("pm25 reading success");
Serial.println();
Serial.println(F("---------------------------------------"));
Serial.println(F("Concentration Units (standard)"));
Serial.println(F("---------------------------------------"));
Serial.print(F("PM 1.0: ")); Serial.print(data.pm10_standard);
Serial.print(F("\t\tPM 2.5: ")); Serial.print(data.pm25_standard);
Serial.print(F("\t\tPM 10: ")); Serial.println(data.pm100_standard);
Serial.println(F("Concentration Units (environmental)"));
Serial.println(F("---------------------------------------"));
Serial.print(F("PM 1.0: ")); Serial.print(data.pm10_env);
Serial.print(F("\t\tPM 2.5: ")); Serial.print(data.pm25_env);
Serial.print(F("\t\tPM 10: ")); Serial.println(data.pm100_env);
Serial.println(F("---------------------------------------"));
Serial.print(F("Particles > 0.3um / 0.1L air:")); Serial.println(data.particles_03um);
Serial.print(F("Particles > 0.5um / 0.1L air:")); Serial.println(data.particles_05um);
Serial.print(F("Particles > 1.0um / 0.1L air:")); Serial.println(data.particles_10um);
Serial.print(F("Particles > 2.5um / 0.1L air:")); Serial.println(data.particles_25um);
Serial.print(F("Particles > 5.0um / 0.1L air:")); Serial.println(data.particles_50um);
Serial.print(F("Particles > 10 um / 0.1L air:")); Serial.println(data.particles_100um);
Serial.println(F("---------------------------------------"));
delay(10000);
// Calculate the AQI based on the PM 2.5 concentration
float c = data.pm25_standard; // check difference btw data.pm25_standard and data.pm25_env
float aqi;
if (c >= 0 && c <= 12.0) {
aqi = 50.0/12.0 * c;
} else if (c > 12.0 && c <= 35.4) {
aqi = 50.0/23.4 * (c - 12.0) + 50.0;
} else if (c > 35.4 && c <= 55.4) {
aqi = 100.0/20.0 * (c - 35.4) + 100.0;
} else if (c > 55.4 && c <= 150.4) {
aqi = 150.0/95.0 * (c - 55.4) + 150.0;
} else if (c > 150.4 && c <= 250.4) {
aqi = 200.0/100.0 * (c - 150.4) + 200.0;
} else if (c > 250.4 && c <= 350.4) {
aqi = 300.0/100.0 * (c - 250.4) + 300.0;
} else if (c > 350.4 && c <= 500.4) {
aqi = 400.0/150.0 * (c - 350.4) + 400.0;
} else {
aqi = -1;
}
// Round the AQI value to the nearest integer
int aqicurrent = round(aqi);
// 7 Seg Update-----------------------------------------------
matrix.println(aqicurrent);
matrix.writeDisplay();
//set strip color
if ( aqicurrent>= 0 && aqicurrent <= 50.0) {
strip.Color(228, 0, 0);
} else if (aqicurrent > 50.0 && aqicurrent <= 100) {
strip.Color (255, 255, 0);
} else if (aqicurrent > 100.0 && aqicurrent <= 150.0) {
strip.Color (126, 255, 0);
} else if (aqicurrent > 150.0 && aqicurrent <= 200.0) {
strip.Color (0, 225, 0);
} else if (aqicurrent > 200.0 && aqicurrent <= 250.0) {
strip.Color (63, 143, 151);
} else if (aqicurrent > 250.0) {
strip.Color (0, 126, 32);
}
strip.setBrightness(BRIGHTNESS);
strip.show(); // Initialize all pixels to 'off'
//strip.Color();
//PIXELS TURN ON
pixels.clear(); // Set all pixel colors to 'off'
int lightnum = (aqicurrent/5) + 1;
for(int i=0; i<lightnum; i++){
if ( aqicurrent>= 0 && aqicurrent <= 50.0) {
pixels.setPixelColor(i,pixels.Color(228, 0, 0));
} else if (aqicurrent > 50.0 && aqicurrent <= 100) {
pixels.setPixelColor(i,pixels.Color(255, 255, 0));
} else if (aqicurrent > 100.0 && aqicurrent <= 150.0) {
pixels.setPixelColor(i,pixels.Color(126, 255, 0));
} else if (aqicurrent > 150.0 && aqicurrent <= 200.0) {
pixels.setPixelColor(i,pixels.Color(0, 225, 0));
} else if (aqicurrent > 200.0 && aqicurrent <= 250.0) {
pixels.setPixelColor(i,pixels.Color(63, 143, 151));
} else if (aqicurrent > 250.0) {
pixels.setPixelColor(i,pixels.Color(0, 126, 32));
}
pixels.show(); // Send the updated pixel colors to the hardware.
}
// The first NeoPixel in a strand is #0, second is 1, all the way up
// to the count of pixels minus one.
// pixels.Color() takes GRB values, from 0,0,0 up to 255,255,255
// colors are in GRB
// green: 228, 0, 0
// yellow: 255, 255, 0
// orange: 126, 255, 0
// red: 0, 255, 0
// purple: 63, 143, 151
// maroon: 0, 126, 32
}

