No higher resolution available.
BloodSugarResultsOfUserGeorgedappilly2013Onwards.jpg (749 × 508 pixels, file size: 153 KB, MIME type: image/jpeg)
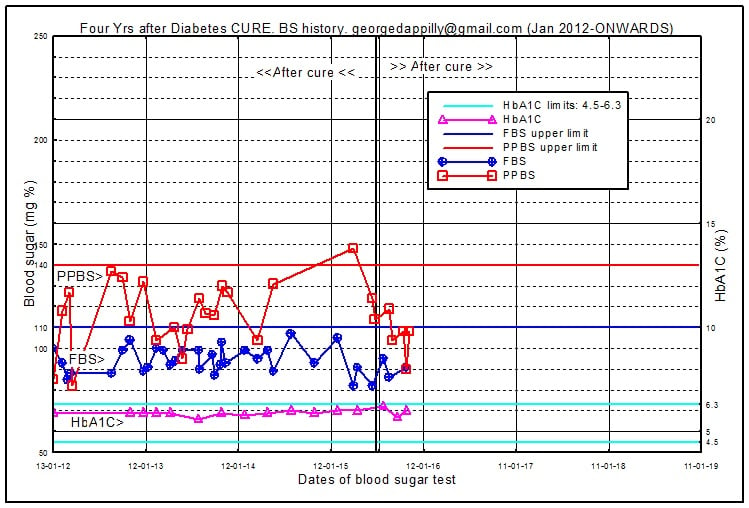
This is the continuation of history from 2006 to 2012 end. This is drawn separately since the earlier space is full.
I have drawn this graph using my blood sugar lab/glucometer test results.
File history
Click on a date/time to view the file as it appeared at that time.
| Date/Time | Thumbnail | Dimensions | User | Comment | |
|---|---|---|---|---|---|
| current | 12:53, 17 November 2015 | | 749 × 508 (153 KB) | Georgedappilly (talk | contribs) | Latest blood sugar values included. |
| revert | 15:21, 10 November 2015 |  | 749 × 508 (153 KB) | Georgedappilly (talk | contribs) | Recent results up to Nov 3, 2015 incorporated. |
| revert | 16:37, 8 June 2014 |  | 749 × 507 (143 KB) | Georgedappilly (talk | contribs) | Blood sugar values up to May 2014 incorporated. |
| revert | 06:52, 21 August 2013 |  | 749 × 508 (141 KB) | Georgedappilly (talk | contribs) | New test results of August 2013 showing further reduction in HbA1c from 5.9% to 5.6% included. (This is the continuation of blood sugar history from 2006 to 2012 end. This is drawn separately since the earlier graph space is full. I have drawn this graph |
| revert | 15:12, 10 July 2013 |  | 749 × 508 (139 KB) | Georgedappilly (talk | contribs) | Blood test results (FBS, PPBS & HbA1C) from Jan toJun 2013 included in the graph. |
| revert | 11:41, 5 June 2013 |  | 749 × 508 (138 KB) | Georgedappilly (talk | contribs) | This is the continuation of history from 2006 to 2012 end. This is drawn separately since the earlier space is full. I have drawn this graph using my blood sugar lab/glucometer test results. |
You cannot overwrite this file.
File usage
The following page uses this file: