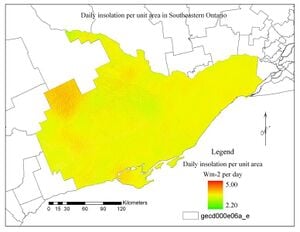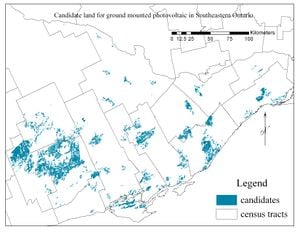
This is an investigation of the capacity and capabilities of the module r.sun, one of the utilities of the Geographical Resources Analysis Support System (GRASS). Using Southeastern Ontario as case study, insolation, including temporal and spatial variation of albedo, was computed to output reliable solar energy for large scale solar PV farm development in the region.
Full text of study available here: H.T. Nguyen and J.M. Pearce, "Estimating Potential Photovoltaic Yield with r.sun and the Open Source Geographical Resources Analysis Support System" Solar Energy 84, pp. 831-843, 2010. open access
Background[edit | edit source]
A comprehensive background for modeling solar energy can be found in Duffie J.A. and W.A. Beckman. (1991). Solar Engineering of Thermal processes. John Wiley & Sons, 2ed.
Hofierka J., Šúri M. (2002). The solar radiation model for Open source GIS: implementation and applications. Proceedings of the Open source GIS - GRASS users conference, Italy. provides a detailed guide on how to run the module.
Methodology[edit | edit source]
The methodology is divided into three parts: (1) pre-simulation, (2) simulation and (3) post-simulation. Pre-simulation details data input acquisition and manipulation to meet r.sun's parameters, which were often lightly treated, but are often the most time consuming and challenging part of any GIS related project. Therefore pre-simulation steps will be presented here in a transparent fashion to ease the work of upcoming PV deployment projects and to make the methodology as omniapplicable as possible. Simulation is the running of the package itself. Post-simulation will include calculating of an annual yields based on monthly estimates and optimal siting for candidate solar parks/farms. Due to the complex nature of modeling radiation and the relatively unfamiliarity of the scientific community outside Europe with r.sun to ensure precision many steps were carried out on the proprietary ArcMap software version 9.3. However, the GRASS counterpart for a step is included in order to allow for greater access.
The required data inputs include:
- Census Subdivisions (CSD) of the 14 counties in the RER
- Soil types for forestry
- Soil types for agriculture
- Land use classification (exclusive of agriculture)
- Digital Elevation Model (DEM)
- Slope/ inclination: the angle between the plane of the surface in question and the equator plane
- Aspect/ orientation: the surface azimuth angle, the deviation of the projection of the normal to the
plane in question on the equator plane from the local meridian
- Latitude: the angular location north or south of the equator‟s plane
- Albedo: the ratio of diffusely reflected radiation on a surface to its incident radiation
- Mean days and corresponding angular position of the sun
- Linke turbidity: a convenient approximation to model the atmospheric absorption and scattering
of the solar radiation under clear skies
- Ground-measured values of global horizontal irradiation (GHI)
- Clear sky index Kc: ratio of the global horizontal irradiance to the global horizontal irradiance
under clear sky conditions6. It is important not to confuse and hence misuse this definition with those for insolation clearness index and clear sky insolation clearness index
Result[edit | edit source]

The available land for solar farm development in the case study of the RER totals 935,000 acres. The solar farms that are under construction in Ontario and of significant capacity are located in West Carleton (200 acres, 20 MW); Sault Sainte Marie phase II (500 acres, 40 MW) and Sarnia (1,100 acres, 80 MW). Although the latter two are located in northern and southwestern Ontario they provide an overview of the area efficiency of solar farms in the region, which is defined as the area required to produce 1 MW rated power. Assuming the lowest land efficiency, which is 10 kW per acre of the West Carleton farm (and also the most geographically relevant case), and given the rounded down 900,000 acres of available land, the RER can house at least 4,500 solar farms identical to West Carleton. In total the RER could thus supply 90,000 MW or 90 GW in peak power using only marginal land and very conservative estimates. This is nearly 60% of Ontario's projected peak electricity demand in 2025 or 6 times the current goal for the amount of additional clean generation to Ontario's electricity system. The result is not only outstanding in terms of coal-fired electrical generation alleviation as Ontario complies with its mandate to eliminate all coal fired electricity by 2014, but also in terms of economic opportunities. Solar PV in Ontario, if aggressively pursued, has a potential of creating thousands of jobs and achieving grid parity between 2016 and 2020.
Future work[edit | edit source]
- Open source the whole methodology
- Test the procedure on other regions e.g. Southeast Asia
See also[edit | edit source]
- For this project
- A transition from ArcGIS to open source GIS softwares
- Modeling methods with spatial climate data
- Related projects
- Estimating the rooftop PV potential of a large-scale geographical region
- Automated quantification of solar photovoltaic potential in cities
- Power and energy potential of mass-scale photovoltaic noise barrier deployment- A case study for the U.S.
- General Design Procedures for Airport-Based Solar Photovoltaic Systems
- Electric Vehicle Charging Potential from Retail Parking Lot Solar Photovoltaic Awnings
- Performance and analysis of retail store‐centered microgrids with solar photovoltaic parking lot, cogeneration, and battery‐based hybrid systems