Theory
The system used in-line four point probe method which works as depicted in the following figure:

Four needle with equal spacing is placed on the sample to be measured, and a current source is connected to the outer pair of needles. Then the voltage generated between the inner pair of needles is measured. Then the sheet resistance is measured with the formula:
Sheet Resistance = Constant * (Voltage measured / Current value)
Where the constant is 4.532 if the following conditions are true:
- The diameter of the sample is large compared to distance between the needles.
- The thickness of the sample is small compared to distance between the needles.
- The location of the needles is not too close to the edge of the sample.
If these conditions are not met, please follow the references in the paper to calculate the correction factor required.
User Interface
The Java user interface can be downloaded from.[2] Go to Java folder there and download OS4PP.jar. Make sure Java Runtime Environment is installed, and double click the.jar file to run the software.
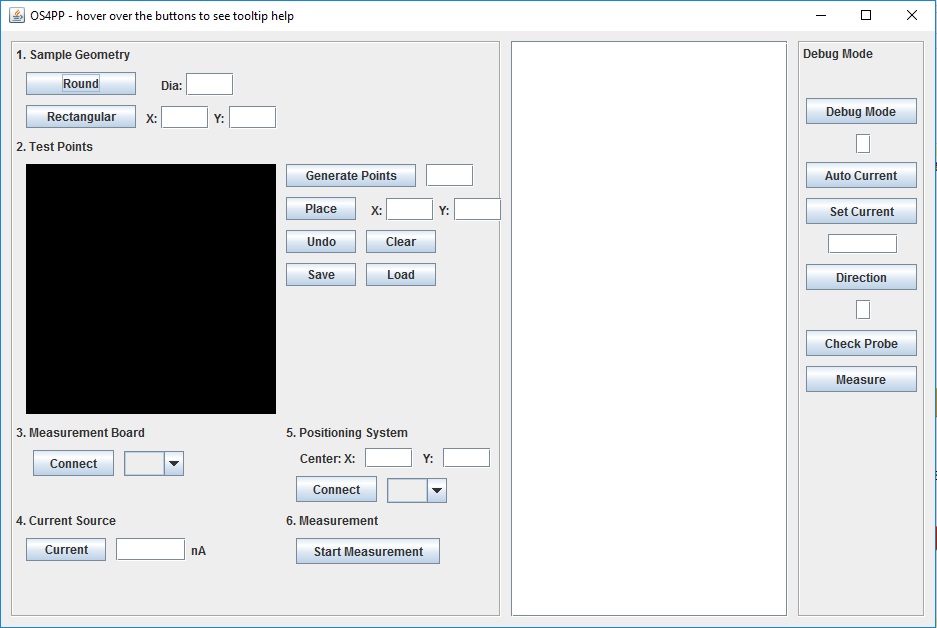
The user interface is designed so that the user just have to follow the numbered steps to fill the information needed to perform the automatic four point probe measurement. In the left part of the UI is where the user can enter information about the measurement. The middle part will report real time status of the ongoing measurement. The right part is reserved for debugging purposes where users can send command directly to the Teensy board in the measurement circuit board. Note that you can hover the mouse over each items in the user interface to display tooltip help.
The user interface will always save ongoing measurement data automatically to a results.csv file in the same folder with the software. Each time a new measurement is performed, the file results.csv will be overwritten. The file results.csv will contain the coordinate, current value and voltage measured at each point. The software also has the capability to save and load the configured measurement points to a config.csv file through save and load button. The file config.csv will be saved in the same folder with the software
Sample Geometry
Enter the diameter or X and Y dimensions of the sample in mm. Then click Round or Rectangular to enter the setting to the software.
Test Points
Enter the number of points to be automatically generated, then click Generate Points button. Alternatively, points can be added by manually entering the X and Y coordinate of the desired point and clicking Place button. Note that coordinate (0, 0) is the top left of the image box on the software. You can find out coordinate of desired point by hovering the mouse over the image box on the software.
Button Undo is used to delete the last point manually inserted, and button clear is used to clear all points. Save and Load button is used to save and load points coordinate data into a file named config.csv in the same folder with the software.
Measurement Board
Select the COM port that the measurement circuit is connected to in the drop down list, and click the connect button. Easiest way to know which COM port is to unplug the usb connection to the measurement circuit and take note which COM port is missing from the drop down list.
Current Source
Insert the desired current value in nanoampere unit from 10 - 10,000,000. Enter 0 to perform automatic current adjustment. Click Current button to enter the value to the software.
Positioning System
Insert the center coordinate of the positioning system bed (in terms of the printer coordinate system) in the X and Y text box in mm unit. Then select the COM port that is connected to the positioning system from the drop down list. Then click Connect button. Any system that accepts standard Gcode command over usb serial can be used as the positioning system.
Measurement
Click the Start Measurement button to perform automatic measurement. Place the sample on the bed and align the middle of the sample to the middle of the bed (the center coordinate inserted earlier in step 5). The positioning system will perform homing first and then will move the probe to each coordinate inserted in step 2. The measurement circuit will automatically perform measurement and display the results in the middle section of the user interface.