In our increasingly disposable global economy, up-cycling products is a critical consideration for diverting waste from landfills and reducing greenhouse gas (GHG) emissions. While anecdotally successfully, up-cycling still needs rigorous analysis to determine it's potential for reducing waste and green house gas emissions. Pint glass replacements for a local restaurant in Arcata, California, United State of America were the basis of this analysis. In order to determine the foot print reduction of a novel pint glass up-cycling method, an analysis of newly manufactured pint glasses typically ordered by the restaurant was necessary.
The research project was a collaboration between Cal Poly Humboldt's Engr308 Technology and the Environment and Blondie's Food and Drink during the Fall of 2021.
The client liaison on this project is
Johanna Nagan of Blondie's Food & Drink
The objective of this project is to analyze and compare the impacts of Upcycled Pint Glasses (UPGs) versus new Libbey Pint Glasses (LPGs) in the terms of embedded carbon dioxide emissions and embedded energy, as well as as there per unit cost.
Findings
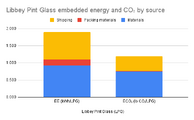
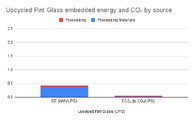
This study of UPG and LPG compared two main metrics: carbon dioxide emissions and embedded energy. It was concluded that the materials used, the transport of, and packaging of a single LPG required 1.89 kilowatt-hours of energy and is responsible for 1.20 pounds of carbon dioxide emissions. The bulk of this associated with the Materials and Shipping components. In comparison, a single UPG is responsible for using 0.43 kilowatt-hours of energy and releasing 0.06 pounds of carbon dioxide, almost entirety as a result of the materials used during manufacturing.
The assumptions used to obtain these results can be seen below in further detail in the section titled Caveats.
Libbey Pint Glass (LPG)
Upcycled Pint Glass (UPG)
Embedded Energy (kWh/glass)
1.89
0.43
Embedded Carbon Dioxide (lb CO₂/glass)
1.20
0.06
Based on the numbers shown above, we are able to conduct a comparative analysis showing the embedded energy and CO₂ between a single Libbey Pint Glass and a single Upcycled Pint Glass. The calculations and assumptions used to acquire these results can be seen in further detail in the following spreadsheet:
Pint Glass Analysis Spreadsheet
The spreadsheet allows for others interested in performing a similar analysis to easily input values pertaining to their particular study area. It is our hope that with this information and the assembled spreadsheet, other institutions will be able to reach similar compelling conclusions that have the potential to influence future policies.
Embedded energy and CO₂ of a single Upcycled Pint Glass by source.
Libbey Pint Glasses
New glass is made up of: Sand (silica), soda ash (Na2Co3), limestone (CaCO3) feldspar (aluminum silicates) and small amount of additives. These materials are mined and melted together to create glass. The acknowledgement of additives is made but not inputted in the data. For the sake of clean data, we assume the glass components as one solid source for embedded energy. The heat of fusion within glass is defined as the energy needed to transform particular amounts of a batches raw materials starting at room temperature to a kg of glass. It also should be noted Libbey's form of melting the material down is done in batches.[1][2][3][4]
Materials
Embedded Energy and CO2 Emissions of Libbey Pint Material
Materials
Embedded Energy
Embedded CO2
Embedded energy in kWh/LPG
Embedded CO2 in kg CO2/LPG
Glass
2.17
kWh/kg glass
1.77
kg CO2e/Kg
0.915
kWh/LPG
0.747
kg CO2/LPG
The various stages of processing are listed below along with their associated energy cost in both imperial and metric units. Melting and refining is by far the most energy intensive aspect and should be the focus in terms of studying sustainable reductions.
Embedded Energy For All Glass Processing
Process
Embedded Energy
Batch Preperation
500000
Btu/ton
146.5
kWh/Ton
0.15
kWh/kg
Melting / Refining
5800000
Btu/ton
1699.4
kWh/Ton
1.70
kWh/kg
Forming
400000
Btu/ton
117.2
kWh/Ton
0.12
kWh/kg
Forming Finishing
700000
Btu/ton
205.1
kWh/Ton
0.21
kWh/kg
Pint Glass Processing Subtotal
7400000
Btu/ton
2168.2
kWh/Ton
2.17
kWh/kg
Packing Materials
Libbey Pint Glasses are purchased in bulk by Blondie's from their website. Since Libbey used a standardized packing method information from their website can be used to calculated the per unit weight of packing materials so the embedded energy and carbon can be determined.[5][6][7][8][9]
Libbey Pint Glass Packaging
Materials
Material used per box (unit/box)
Material used per glass
Embedded Energy (kWh/unit)
Embedded Energy (kWh/LPG)
Embedded CO2 (kg CO2/kg)
Embedded CO2 (kg CO2/pint glass)
Cardboard box
1
box
0.0417
box/LPG
4.00
kWh/box
0.1667
0.94
0.004073
Tape
0.0006
kg/box
0.000025
kg/LPG
21.31
kWh/kg
0.0128
6.00
0.000000
Cardboard dividers
0.0672
kg/box
0.0028
kg/LPG
8.33
kWh/kg
0.0016
1.53
0.004284
Total kWh/pint glass
0.1810
Total lbs CO2/pint glass
0.008357
Cardboard box
0.104
kg
Box dimensions
Length
14.00
in
Width
10.50
in
Height
11.75
in
Libbey Pint Glass Dimensions
Circumference
3.50
in
Height
5.87
in
Up-cycled Pint Glasses
Embodied Energy (kWh) and Embodied CO2 (lb CO2) in the processing materials to up-cycle wine bottles into UPGs. Compared to LPGs, this a considerable reduction in both embedded energy and carbon, making UPG environmentally more sustainable.
Final Embedded Energy and CO2
Materials
kWh/UPG
lbCO2/UPG
Sandpaper
0.2469
0.0314
Saw Blade
0.1339
0.0023
Totals
0.3808
0.0336
Differences really show in the fact that the process of producing UPGs has to do with reusing wine bottles that already being used through the business. There is no shipping and handling to consider, at least for the actual production, like the LPGs. Not only shipping & handling but there is no need for packaging materials which once again lowers the embedded energy involved in production of UPGs.
Below are the comparisons of costs for a Libbey Pint Glass vs. the processing costs for an Upcycled Pint Glass, showing which is more affordable.
Cost of a single Libbey Pint Glass compared to the cost of a single Upcycled Pint Glass
Breakdown of the total cost for Libbey Pint Glasses.
Breakdown of the total cost for Upcycled Pint Glasses
Costs
LPG
UPG
Unit Cost
Repeats
Equipment
Saw Blade
$0.00
$0.003
Amazon
$19.99
blade
6,789
glasses
Sandpaper
$0.00
$0.16
Amazon
$12.66
6 pack
80
glasses
Cost of Glass
Pint Glass
$0.94
$0.00
Libbey Pint Glass
$25.49
case
24
glasses
Wine Bottle
$0.00
$0.00
S&H
$0.09
$0.00
Gas
$4.99
gallon of gas
30
MPG
12
trips per year
Labor
$0.00
$4.36
Labor
$20.00
hour
4.6
glasses/hr
Electricity
$0.00
$0.01
kWh cost x kWh/glass
$0.14
kWh
0.05
kW/glass
Total Cost per Glass
$1.03
$4.53
All processing costs considered, Libbey Pint glasses are $3.50 per glass cheaper than upcycled pint glasses. LPG cost $1.03 per glass as opposed to the UPG at $4.53 total cost per glass. Libbey Pint Glasses are the more affordable choice between the two. Labor is where the cost really makes the difference as LPG are manufactured, it was assumed there is no labor for individual glasses as opposed to the upcycled pint glasses where there is manual labor involved in the actual process of creation. The labor cost covers about 96% of the total cost for upcycled pint glasses compared to the 0% of labor cost for Libbey Pint Glasses.[20][21][22][23]
$1.03
Processing/Material Costs
$0.00
Labor
$0.17
Processing/Material Costs
$4.36
Labor
A case of 24 Libbey pint glasses costs a total of $25.49 cents making the cost per glass $1.03 including shipping and handling. If you were to match the number of glasses in a LPG case using the price of Upcycled Pint Glasses it would be around a total of $108.72 to create 24 UPG. It's $83.23 more expensive to make 24 upcycled pint glasses from wine bottles. The ratio of UPG to LPG is roughly 5 UPG: 24 LPG.[22]
Total Cost for LPG
$1.03
$/LPG
Total Cost for UPG
$4.53
$/UPG
Research Synthesis
Our findings indicate that, while switching from Libbey Pint Glasses to Upcycled Pint Glasses might save a significant amount of energy and CO2, labor costs make upcycling financially unsustainable. Continuous action to produce Upcycled Pint Glasses will lead to deficits where purchasing Libbey Pint Glasses will continue to be financially plausible. Although there is a motive behind upcycling wine bottles for sustainability of materials and reducing waste, through a business perspective it won't last long due to overwhelming costs.
Caveats
This was a rapid project. The results are very tentative and the spreadsheet is provided so that assertions, math, and assumptions can be checked, tested, or adapted.
Some costs were not taken into account when calculating the costs of upcycling pint glasses. This includes some of the equipment needed for upcycling (e.g. a wet saw and a belt sander)
Next Steps
After completing the initial analysis, there are various alterations to the methods that could be made to create even more accurate results. These include:
More consolidated research is needed when considering costs of upcycling pint glasses.
An exploration of methods to create upcycled pint glasses that have lower labor and material costs is needed.
Cost of washing wine bottles before upcycling them to pint glasses needs to be considered.
Extended research in the impact of switching to UPGs if it was hypothetically financially possible.
Teams
Libbey Pint Glass Materials: Maya, Jacob
Libbey Pint Glass Packing/Shipping Materials: Sara, Sydney, Christian
 Embedded energy and CO₂ of a single Upcycled Pint Glass by source.


