Utilization of Virtual Globes for Open Source Industrial Symbiosis
For the full open access text of William Doyle and Joshua M. Pearce, “Utilization of Virtual Globes for Open Source Industrial Symbiosis”, Open Environmental Sciences'', 3, pp. 88-96, 2009. see:open access
Abstract
Several proprietary industrial symbiosis software tools have been developed, however, without long term financial commitments these endeavors fall short of creating generalizable and sustainable tools. The recent development of virtual globes such as Google Earth (GE), an information service that provides imagery and three dimensional data depicting the entire physical earth, provides an opportunity to use a new sustainable method of navigating information to save energy and use materials more efficiently in the real world. To test this open source methodology, a data set was used from the Department of Environmental Protection in Pennsylvania, which has mandated reporting the location of disposal and type of residual waste from sources producing more than one ton per month. This data set was integrated into the GE interface to identify and quantify opportunities for materials and energy efficiency improvements. This investigation found that virtual globes coupled with open source waste information can be used to:
- reduce embodied transport energy by reducing distances to recycling facilities,
- choose end of life at recycling facilities rather than landfills, and
- establish industrial symbiosis and eco-industrial parks on known by-product synergies.
For one waste category, a potential 70% reduction in ton-kilometers was identified by simply observing closer disposal locations than currently utilized; similar reductions are achievable in other categories. It is concluded that the open source sharing of information in virtual globes provide a means to identify economically and environmentally beneficial opportunities for waste management if the data have been made available.
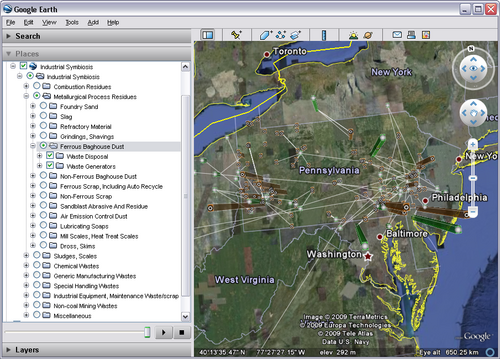
Google Earth Interface for looking at waste products in Pennsylvania

Fig. 1 Google Earth Interface for looking at waste products in Pennsylvania
- As you can see from the figure - any waste stream can be chosen for the entire state and the geographic position at which the waste is created is shown. The large the column the greater the waste in tons. The white lines show the "as a bird flies" distance between waste source and sink.
Collaboration
- If anyone is interested in obtaining either the raw data used in this paper or the kml files to search for additional opportunities to reduce waste in Pennsylvania - please contact --Joshua 08:48, 15 January 2011 (PST) We really have just scratched the surface with what can be done by coupling GIS and industrial symbiosis even with this data set.