Chapter 5 - Financial appraisal of small-scale production
Introduction[edit | edit source]
The type of analysis required to determine whether an investment should be made in a feed mill depends upon the size and complexity of the investment under consideration and on who is making the investment decision. For larger and more complex projects it is useful to distinguish between three stages in the decision-taking process, involving increasing depth and detail in the analysis. The stages are frequently labelled the 'opportunity study', the 'pre-feasibility study' and the 'feasibility study'. Such a procedure can eliminate non-viable projects at an early stage and thus save time and money. For smaller investments, the distinction between these three stages becomes blurred. In the case of most investments in small-scale feed mills it is sufficient to distinguish between two stages. In the first stage, the raw material, energy supply and demand situation is assessed in general terms together with an assessment of the conditions in the economy and of government policy measures which are likely to impinge upon the success of the project. The second stage involves a cost benefit analysis.
Preliminary assessment[edit | edit source]
A preliminary analysis of a small-scale feed mill project should give a good indication of the likely feasibility of the project without the complete assessment of costs and returns which would be required to indicate a precise rate of return on investment. It should give, in particular, an assessment of the availability, cost and reliability of the supply of ingredients, the cost and reliability of the energy supply and the demand for compound feeds with particular reference to determining the scale of operation and the product mix. In addition, attention must be given to the requirements for ancillary services, such as storage and transport facilities (both for raw materials used and for feed produced), facilities for quality control, facilities for maintenance and repair of equipment including replacement of spare parts, and requirements for training of mill operators. Inadequate consideration of these factors may lead to project failure or heavy losses. A check list of factors to be considered is given in Appendix 5.
The cost models[edit | edit source]
This section describes the development and appraisal of cost models for the four compound feed production systems discussed in Chapter 4 page 20. Methods of calculating break-even costs per tonne of compound feed are described and illustrated in detail. This information should enable the potential producer to construct his own model, with any appropriate modifications, and to estimate his own costs of production. These costs can then be compared with the prices of similar, commercially manufactured, products to see whether a proposal is financially worthwhile. Financial considerations are not the only factors which need to be taken into account, however. The quality and availability of the commercial alternatives will also be relevant.
This section consists of five parts, namely:
(i) a brief description of those aspects of the production models which are particularly significant from the coatings point of view;
(ii) estimation of basic costs for each model;
(iii) a brief description of the role of discounting in calculating break-even costs;
(iv) calculation of break-even costs per tonne of compound feed for each model, using the discounting method;
(v) model appraisal.
The models
Model 1 is of a simple system buying-in pre-ground feed ingredients and additives which are mixed by hand, without pelleting, on a concrete slab. A shed is used for storage of material. Model 2 has simple but purposebuilt, facilities. Raw materials are ground on the farm. A cement mixer is used for mixing, but compounds are not pelleted. Model 3 is more sophisticated and includes grinding, mixing (by means of a vertical mixer) and pelleting on-farm. Storage is in bulk bins. Model 4 is similar to model 3 but the machinery and equipment has greater capacity and a horizontal mixer is employed. Since, in this model only, compound feeds are manufactured for sale as well as on-farm use, accommodation is also included for office staff. Power for Models 2-4 is supplied by mains electricity. Models 3 and 4 also have standby generators.
It is assumed that all models operate for 300 days per year and that 5 days' production is retained as stocks. Daily operating periods and annual production are assumed to be as follows:
|
Model number |
1 |
2 |
3 |
4 |
|
Hours operated per working day |
1 |
1 |
3 |
8 |
|
Annual production, tonnes |
30 |
60 |
900 |
4,200 |
Only a quarter (1,050 tonnes) of the compounds manufactured in Model 4 are retained for on-farm use. The rest (3,150 tonnes) is sold in nonreturnable bags. Buildings and major items of machinery and equipment are assumed to have a 15-year life in all models.
Estimation of basic costs
Methods of estimating establishment and operating costs, and working capital requirements, on a comprehensive and systematic basis, are described in detail in Appendix 5 by means of a linked series of annotated tables. The costs are projected as a series of annual cash flows. In the models presented in this bulletin all inputs are charged at realistic market rates. However, market rates can vary considerably from country to country and it should be borne in mind that neither the basic costs nor the breakeven costs estimated from them in this section are of general application. Potential compounders must substitute their own costs when carrying out appraisals.
Some of the resources required for compound feed manufacture, for example building or equipment, may already be available on site. In a project appraisal the value of these resources would normally be included in the capital costs or an appropriate rent would be charged in the operating costs. However, charges would be made for these resources only if they could be used for some other purpose than compound feed manufacture, or sold. In economic terms, such resources are said to have en 'opportunity cost.*' If they cannot be used in some other enterprise, or sold, such resources would have no opportunity cost and no value would be assigned to them in the coatings
It may not be easy to value resources which are already available, particularly buildings, even though they clearly have an opportunity cost. For example, it may be especially difficult to value well-maintained buildings which could be used for compound feed manufacture (or other activities) but which are of unnecessarily high quality for the purpose. In the absence of a better estimate of opportunity cost, a valuation might be based on the estimated cost of a new building, but only to the technical specification required for compound feed manufacture. Valuations of existing items of machinery or equipment which could be used for manufacturing compound feeds should not be particularly difficult to make since they could be based on second-hand market values or appropriately depreciated replacement costs. Any increases in labour costs resulting from compound feed manufacture should be charged to the compound feed account. However it may be possible to add a compound feed production enterprise to an existing farming system at low, or even zero, opportunity cost in cases where the existing labour force is under-employed.
By extension of the same principle, if they are saleable, any home-grown cereals used as feed ingredients should normally be costed at their farmgate market value, rather than their cost of production, since if they are used in a concentrate mix, any profit which could have been obtained by selling them is foregone.
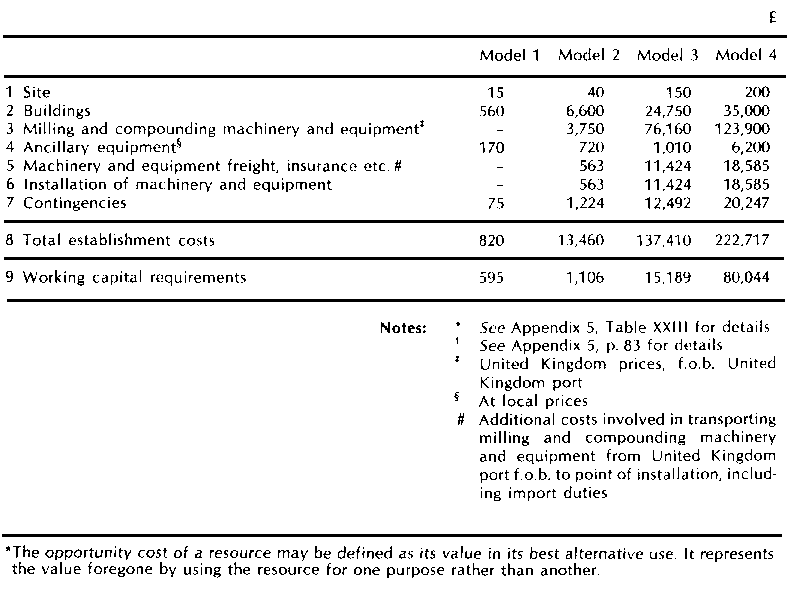
Summaries of establishment costs and working capital requirements for the four models are presented in Table 3. Establishment costs (in £ sterling) range from £820 (Model 1) to £22,717 (Model 4). Fixed machinery and equipment costs (items 3, 5 and 6) account for over 70% of total establishment costs in Models 3 and 4 but for only 36% in Model 2, building costs being the largest single item of cost for this model. There is no fixed machinery and equipment in Model 1 and buildings make the largest contribution to total establishment costs. It is important that prospective feed compounders obtain up-to-date quotations for machinery and equipment.
Table 3 - Summary of establishment costs* and working requirementst
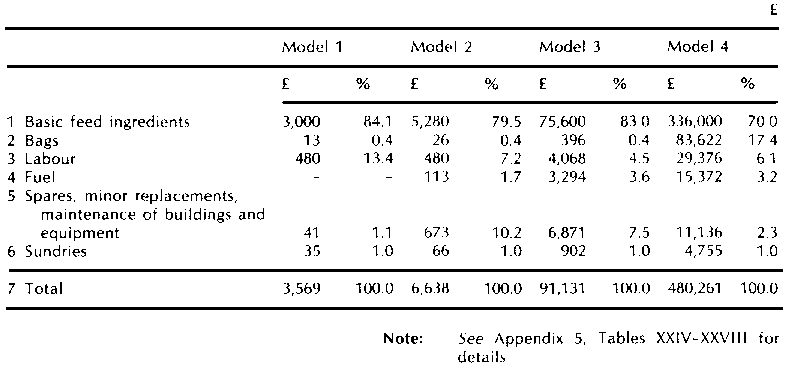
Table 4 - Summary of annual operating costs
Working capital is required to finance the purchase of stocks of operating inputs and to cover the short-term operating costs incurred on each batch of products manufactured, prior to their sale or utilization by other enterprises. Estimated working capital requirements range from £595 in Model 1 to £80,044 in Model 4. However, working capital requirements will vary appreciably according to circumstances.
Annual operating costs are summarized in Table 4. In all cases, as would be expected, by far the most important operating cost is that for the purchase of raw materials. In Models 1-3, these costs account for at least 80% of total operating costs. In Model 4 the percentage drops to 70%, mainly because of the cost of non-returnable bags for the 75% of total production which is sold. Labour and fuel costs are relatively small. Total operating costs vary from £3,569 per year in Model 1 to £480,261 per year in Model 4.
The role of discounting
Normal investment projects can be expected to generate a series of negative and positive annual cash flows (costs and returns respectively) over a long period of time. Some of these cash flows are irregular, in particular for capital investments which can normally be expected to have a useful life of many years. In an appraisal, however, the value of a projected cash flow of a given size will vary according to its timing, irrespective of the possible effects of inflation or risk and uncertainty factors. For example, a return of £10,000 this year is clearly preferable to a similar return 10 years hence since it could immediately be invested in a new project, lent to generate interest or used to pay off a debt. At a compound rate of return of 10% per year it would be worth £25,937 in ten years' time.
For the purpose of estimating project costs, a method of discounting is required in order to convert the series of costs projected over the life of the project to a common base, namely, their Present Value (PV). In fact, discounting is essentially the compound interest calculation in reverse. For example, discounting a cost of £10,000 expected in ten years' time gives a PV cost of £3,855.
Normally, in calculating the break-even cost, the appropriate discount rate would be the market rate for loan capital. If a lower rate is chosen, the cost of borrowing capital, that is to say the interest payments which have to be made on loan capital, would not necessarily be fully recovered if the project were implemented. In the case of equity capital, choosing a discount rate below the market rate could lead to lower returns from investments in the project than would have been obtainable by lending the capital commercially.
The calculation of break-even costs per tonne of compound feed
Break-even costs per tonne of compound feed are calculated by equating the PV of total costs arising over the life of the project with the PV of total returns. Product price calculated from this equation is therefore equal to the break-even cost per tonne. The cost per tonne, when annual operating costs and annual production are constant over the life of the project, can be calculated by means of the following formula:
the sum of the PVs of discounted total capital costs (£)
divided by the annuity factor,
divided by annual production (tonnes); plus
annual operating costs divided by annual production.
The annuity factor is the sum of the annual discount factors over the life of the project. The mechanics of the method of calculation are described in detail in Appendix 5, Tables XXIX-XXXII by means of annotated tables for all four models, assuming a discount rate of 10% per year and a project life of 15 years. Annual discount factors and the annuity factor are given in the tables for the 10% discount rate. The formula and method for estimating break-even costs when annual operating costs and annual production vary are given in the notes to the tables.
Break-even costs per tonne are summarized in Table 5. Total break-even costs, at the levels of production specified, vary from £122.96 per tonne for Model 3 to £143.32 for Model 2. The cost of the simplest system, that is Model 1, is £125.04 per tonne. It can be seen that operating costs are much higher than capital costs. They also reflect the quantity discounts for feed ingredients assumed in the basic costs (see Appendix 5, Table XXIV for details). The average operating cost per tonne for Model 4 is higher than for Model 3 because it includes the cost of non-returnable bags for the 75% of total production that is sold.
|
Model 1 |
Model 2 |
Model 3 |
Model 4 |
£ | |
|
Annual production, tonnes |
fed on farm |
30 |
60 |
900 |
1,050 |
|
sold |
3,150 | ||||
|
total |
30 |
60 |
900 |
4,220 | |
|
Hours per day |
system operating |
1 |
1 |
3 |
8 |
|
Break-even costs, £ per tonne |
capital costs |
|
32.69 |
21.70 |
|
|
operating costs |
118.97 |
110.63 |
101.26 |
114 35 | |
|
Total costs |
125.04 |
143.32 |
122.96 |
123.19 |
Note: For details see Appendix 5, Tables XXIX-XXXII
Model appraisal
The potential producer should estimate break-even cost per tonne for the model appropriate to his own particular circumstances, using the methods described above. This cost should then be compared with the cost of buying-in commercial compounds if available. This would show whether on-site production would be financially worthwhile. Other factors would probably also have to be considered. For example, commercially produced compounds might be of poor or inconsistent quality, or supplies might be erratic. In these circumstances, on-site compounding might be preferable to buying-in, even if costs were somewhat higher, as the only way of maintaining adequate supplies of high quality compound feeds.
If, on initial investigation, a model proves to have a break-even cost per tonne which is a little too high to be acceptable, it may still be possible to achieve project viability by reducing costs. Even in cases where costs are acceptable in the original estimate, it may be necessary to ensure that project viability will be maintained if conditions change in certain ways. In other words, an investigation of the sensitivity of break-even costs to possible changes in costs, level of production, etc. would normally form part of any comprehensive project appraisal, but the tests which need to be made will depend on the particular circumstances of the case. Examples are given in this section for three different situations, namely:
(i) where a reduction in costs is needed if project viability is to be achieved;
(ii) where the original model is viable, because costs of production are acceptable, but where there is a possibility that the demand for the product may have been overestimated; and
(iii) where the original model is viable but where there is uncertainty about the levels of certain future costs.
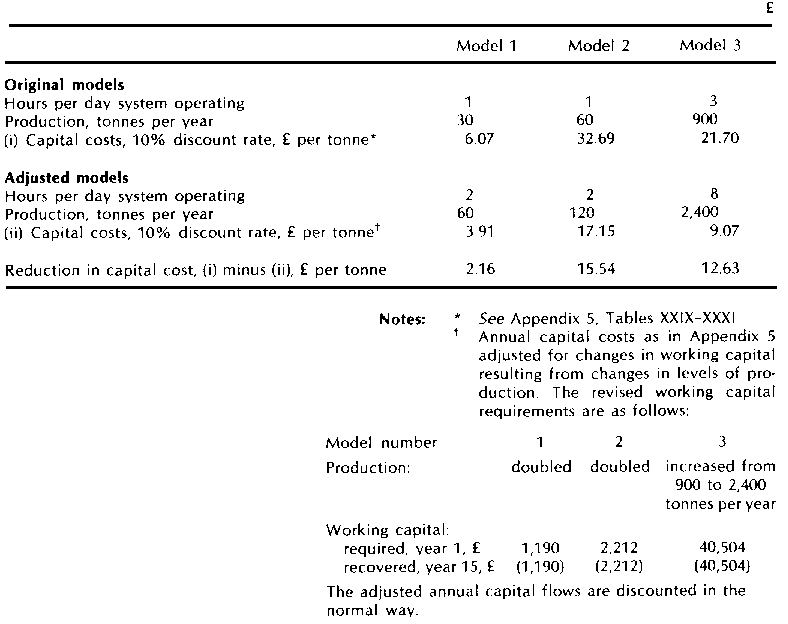
An example of the first situation is shown in Table 6 for Models 1-3. Two assumptions are made, first, that an acceptable market is available for any increased production of compounds, and second, that operating costs and working capital requirements are constant per unit of output at all levels of production. Under these conditions, total costs per tonne can be reduced by increasing production and reducing fixed, or overhead, costs per unit of product. In other words, better use can be made of installed capacity by operating the unit for longer periods. The main component of capital costs consists of the fixed establishment costs needed to purchase the site, buildings, machinery and equipment. As can be seen from Table 6, the result of doubling production is to reduce capital costs per tonne by only £2.16 in Model 1, where capital investments are low and the scope for reduction of overheads is limited, and by £15.54 per tonne in Model 2 where capital investments are high and utilized capacity is low. As a result of these changes, total costs per tonne would be reduced from £125.04 to £122.88 in Model 1 and from £143.32 to £127.78 in Model 2. Making better use of installed capacity by increasing production in Model 3 would also lead to a substantial reduction in unit costs (£12.63 per tonne). Depending on the price, quality and availability of commercial alternatives, these reductions in break-even costs per tonne of compound associated with increased production levels may be sufficiently high to ensure project viability.
Table 6 - The effect of increasing production on capital costs per tonne
The effect on unit price of the second situation, assuming demand has been over-estimated in the original model, is illustrated in Table 7 for Model 4. If sales should prove to be lower than expected so that production had to be cut by a half to 2,100 tonnes per year, capital costs per tonne would rise by £7.17. Total costs per tonne would increase from £123.19 to £130.36 and such an increase could make the project unviable. If there is a possibility that such a situation might arise, a more detailed investigation of the market prospects for the product might be needed before a final decision can be made on the acceptability of the project.
The third situation, which is essentially concerned with the effect on break-even costs per tonne of changes in basic costs, is illustrated in Table 8 for changes in the cost of borrowing capital, that is for changes in the interest or discount rate. The effects of a fall in the interest rate from 10% to 72% per year and a rise to 12½% or 15% per year are shown for all four models. As can be seen for Model 2, where output is 60 tonnes per year and utilization of available capacity on a time basis is low (the system only operates one hour per day), capital costs at a discount rate of 10% per year are £32.69 per tonne. If interest rates fell to 72% per year, costs would be reduced by £4.46 per tonne. If, on the other hand, interest rates rose to 12½% or 15% per year, costs per tonne would rise by £4.67 and £9.54 respectively and might affect the viability of the project. Changes in cost associated with similar changes in interest rates are less dramatic in the other models. This is because capital investment is low in Model 1 and because better use is being made of installed capacity in Models 3 and 4, even though capital investments are high.
Table 7 - The effect of decreasing production on capital costs per tonne, Model 4
|
£ | |
|
Original model |
|
|
Hours per day system operating |
8 |
|
Production, tonnes per year |
4,200 |
|
(i) Capital costs, 10% discount rate, £ per tonne* |
|
|
Adjusted model |
|
|
Hours per day system operating |
4 |
|
Production, tonnes per day |
2,100 |
|
(ii) Capital costs, 10% discount rate, £ per tonne** |
16.01 |
|
Increase in capital cost, (i) minus (ii), £ per tonne |
|
Notes: *,** As for Table 6 except that revised working capital requirements are £58,404
Table 8 - The effect of changing the discount rate on capital costs per tonne
|
£ | |||||
|
Model 1 |
Model 2 |
Model 3 |
Model 4 |
Source | |
|
Discount rate |
|||||
|
10% |
|
32.69 |
21.70 |
|
Table 3 |
|
7½% |
|
28.23 |
18.57 |
|
* |
|
12½% |
|
37.36 |
24.99 |
10.25 |
* |
|
15% |
|
42.23 |
28.40 |
11.69 |
* |
Note: * Appendix 5, Tables XXX-XXXII, column d in each table discounted
Depending upon the particular circumstances of the case, it may be necessary to carry out a number of sensitivity tests on break-even costs before a decision can be taken on whether or not the profitability of a proposal feed compounding unit is worthwhile. The sensitivity tests may indicate modifications and improvements which could usefully be made to the project as originally proposed. These tests are not difficult to carry out provided they are handled in a systematic manner, using the methods described in this section.


