Team Members[edit | edit source]
- Nicki Gallup, Biomedical Engineering & Mechanical Engineer, Michigan Technological University
- Etienne Michels, Biomedical Engineering, Michigan Technological University
- David Hoffman, Mechanical Engineer, Michigan Technological University
Abstract[edit | edit source]
One in every ten Americans suffer from diabetes and must use a blood glucose monitor or meter to measure their glucose levels in their blood stream. There are a few glucose meter designs currently on the market, but their devices don’t account for environmental conditions, aren’t portable, and are not easily accessible for lay-users. The purpose of this project is to create an open-source blood glucose meter that can be calibrated for multiple test strips and is portable, that doesn't take up too much space for the user. The Bill of Materials was set and parts were ordered and an Adafruit feather-board is the main microcontroller for which we will use to attach our display and run our processing through. Our current challenge is creating a test strip connector in which we can insert the test strip of choice. Test strip connectors are difficult to come by as they are sold in large quantities and really only to medical device companies. The goal for this upcoming semester is to create our own test strip connector, or some way to hook up the test strip to the device itself.
Problem Statement[edit | edit source]
Every Blood glucose meter on the market has specific test strips associated with them. This can be an issue if someone would need to purchase a new meter because they lost or forgot theirs or needed to purchase new test strips because they ran out.
Objectives[edit | edit source]
The objective of this project is to design, create, and demonstrate a low cost, open-source blood glucose meter. This meter will give accurate blood-glucose results using a blood-glucose solution to test the meter and can be calibrated to work with multiple test strips.
Project Constraints[edit | edit source]
Our team had identified the following constraints to ensure the proper capabilities of this blood glucose meter.
- Temperature measurement of the device so that it can provide accurate results when compensating for the test strip.
- Storage of data in the device in mg/dL
- Being able to access the data if someone wants to look back at previous readings.
- Battery life that lasts at least 24 hours when in constant use.
- The device should be small enough to be handheld and durable enough to withstand being dropped from a height of one meter.
Project Standards[edit | edit source]
The following standards will allow for accurate measurements and hit our objectives, as well as follow FDA guidelines for on-market devices.[1] These standards include:
- An accurate blood glucose measurement that is within +/- 15 mg/dL.
- The minimal blood measurement of the blood glucose meter should be 50 mg/dL while maintaining accuracy.
- The maximum blood measurement of the blood glucose meter should be 400 mg/dL while maintaining accuracy.
- Calibration of multiple test strips so that the meter can utilize different test strips currently available on the market.
- The blood glucose meter should adequately measure glucose across the range of 30-55% hematocrit.
Project Planning[edit | edit source]
SEMESTER I[edit | edit source]
Project Initiation[edit | edit source]
A Project timeline was developed for this project in order to have a visual representation of what should be accomplished in this project. The first phase of our project started with the initial research. This includes the types of devices already on the market and the test strips associated with those devices and the way the devices measure the blood glucose levels. The research with the FDA database about regulations and specifications on blood glucose meters followed. Information on the test strips, such as their history and the accuracy, was reviewed as well. We reviewed methods for making our own glucose solution for testing, instead of using blood, and what causes inaccuracies within meter tests. The research part of this project took the first five weeks in order for us to be thorough with our findings. Even now, we continue to search when we want additional information or have an idea. See the Background Research section for further details.
Project Schedule[edit | edit source]

Project Planning and Design[edit | edit source]
The next phase of our project was to create a rough Bill of Materials and Parts List. We weren’t quite sure what exactly our project would entail but began looking at options. From our initial thoughts to ordering, we projected five weeks, where this overlaps with our research phase. Once we began thinking about what our device would entail, the design finalization would begin. This was projected to take 2 weeks to complete. Our project design can be further explained in the Concept Design section.
Project Budget[edit | edit source]
The budget for this project only needed to be one week long, once our bill of materials was finalized. Our budget to spend for this project this semester was $150. Once the bill of materials and design is finalized, the parts can be ordered and the mechanical and electrical CAD can begin. This ordering and CAD beginning is estimated to take four weeks. The CAD and wiring of the system is estimated to take approximately six weeks to complete once all of the parts are in. The circuit and process analysis of the design is estimated to take the same six weeks as the CAD and wiring of the system. The CAD Adjustments and circuit design is estimated to take approximately nine weeks to complete.
Project Testing and Adjustment[edit | edit source]
This phase is where the testing begins. Fatigue tests and circuit tests will be performed for two weeks. The testing and adjustments of the design will take approximately four weeks, to finish up at the end of the semester. This is where the first stages of our own design start to come together. Adjustments need to be made to the test strip connector, as purchasing one online is near-impossible. This test strip connector is the first thing we will tackle at the start of the new year.
Semester II[edit | edit source]
Where We Started
The beginning of semester II came with some challenges. First, we needed to research possibly designing our own test strip reader, looking to purchase one, or fid an alternative solution. Ultimately, to avoid any legality issues, we decided to find an alternative solution to testing blood and being able to read the output current. We found a research paper that another group conducted, which gave us insight on a possible way for us to go.[2] This was an plausible alternative for us as the chemicals and systems would not be overly difficult to obtain.
Project Budget
The budget for this semester was the $150 all three of us contributed, plus any extra that was allocated for the Open-Source Hardware Enterprise. This extra allocation can be used if we go over the $150.
Background Research[edit | edit source]
One in every ten Americans suffer from diabetes. Diabetes is a medical condition where the pancreas struggles to produce insulin in order to maintain the amount of glucose present within the body. Type 1 diabetes is when the body cannot develop the insulin to break down glucose into sugar. Type 2 diabetes have insulin resistance, where their body is unable to use the insulin they produce effectively. Diabetes can be developed with a lifestyle of smoking, being overweight, or physically inactive.[3]
On-demand at-home blood glucose testing is an integral part of diabetics daily lives. Access to easy to use and cheap to operate glucose meters allows for management of their disease outside of a healthcare environment. By being able to self-monitor glucose levels, long term health complications can be delayed by early detection and management of both hyperglycemia and hypoglycemia .[4]
It’s estimated that the annual cost of management for a Type 1 Diabetic is $4,380 per annum, combined with medical bills ranging from $2,811 to $17,564 in the event of severe hypoglycemia that requires treatment.[5] By providing a cheap and open source glucometer, costs of management could potentially be decreased as people would not be required to use a single type of test strip and instead can go for the cheapest option, and instead of replacing the entire device when it fails the component that failed can be replaced for significantly less.
While there exist a couple existing open source designs, their devices don’t account for environmental conditions, aren’t portable, and are not easily accessible for lay-users .[6]
Initial Concept Design[edit | edit source]
The primary method of measurement for blood glucose is via blood sample, and while there have been numerous attempts to develop non-invasive sampling methods, such as reverse iontophoresis, bioimpedance spectroscopy, microwave resonance, and many others, none have been successfully developed into a marketed product.[7] For this reason we decided that it would be more reasonable to focus on increasing accessibility to a proven method than try and develop a novel product so we chose to use the invasive blood sampling method.
There are two primary methods for determining the blood glucose level, amperometric or colorimetric measurements. Both rely on the redox reaction (GOXH3 + O2 = GOX + H2O2) that occurs between the glucose in the blood and glucose oxidase, an enzyme that oxidises glucose to hydrogen peroxide and a byproduct. In colorimetric measurement a chromogenic oxygen acceptor binds to the peroxide and changes color, the absorbance of the sample is measured using colorimetry and Beer's-Lambert's law (A=ebC) is used to calculate the concentration of glucose in the sample.[8] In the amperometric method the movement of the electrons during the reaction is measured as a current which is converted to voltage and compared to a calibration curve to calculate the glucose level. We chose to use the amperometric method as it requires significantly less blood than the colorimetric method, takes less time, and is more accessible to the user.[4] It is also the accepted standard for the majority of the meters currently used by diabetics which makes it easier for new users.[1] An added benefit of the amperometric method is that there are some open source projects that have already created basic amperometric circuits which can be modified and added to as to match our design specifications .[6]
For our design we wanted to be able to display the measurement directly to the user as well as having a history of the measurements stored on the device that can be accessed via a phone or computer. For this reason we chose to use an ESP32 microcontroller which has both bluetooth and WiFi capabilities allowing for multiple possible communication channels. For the user interface we chose an e-ink display due to its low power consumption and form factor. By using Adafruit’s Feather boards for the microcontroller, display, and custom PCB we save both time and effort in design, and leave it open for future modifications as we’ll have a design standard. In order for our design to incorporate the use of multiple test strips, the test strips that are to be used with the meter will need to be calibrated in order for use. This is done manually for each test strip.
Electrical Design[edit | edit source]
The basic functionality of the blood glucose meter is accomplished by using a test strip which creates a small current proportional to blood glucose concentration. That current is then amplified and converted into a voltage by an Operational Amplifier (Op-Amp). The voltage can then be read by a microcontroller and compared with a table of known blood glucose/voltage pairs to determine a final blood glucose measurement..[6]
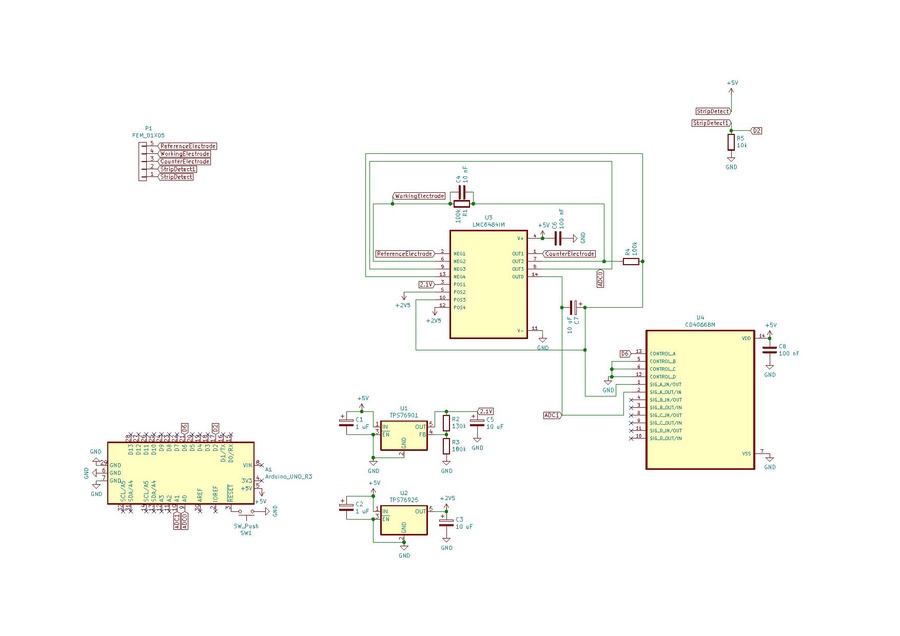
In this schematic the test strip is connected to a quad op amp integrated circuit which feeds into an Arduino Uno. This is a circuit designed by M. Bindhammer and will serve as a basis for our design. We would like to add temperature compensation, data storage, and a clock to the existing design.
Design Analysis & What Happened[edit | edit source]
One challenge that we faced during this project was the test strip connector and the test strip itself. The pins on the test strip were unknown, as there is no open documentation on it. However, we were able to see inside the connector and we know for sure that there are three pins that refer to the reference, working, and counter electrode that connect to the test strip. As we continued looking into this problem, we determined there was no feasible way for us to create our own test strips needed to work for the blood glucose meter and therefore needed to find another alternative to what we could do. There is a possible legal concern with the reverse engineering of the test strips and the test strip connector.
Bill of Materials[edit | edit source]
- LMC6484IM
- Quad OP-Amp Chip
- Used to integrate current and amplify voltage to read blood glucose from the test strip
- TPS76925DBVT
- 2.5 volt linear regulator power supply
- Used to power the OP-Amp circuitry
- TPS76901DBVRG4
- Adjustable voltage linear regulator power supply
- Used to supply a reference voltage to the test strip working electrode
- Programmed using external resistors
- CD4066BM96
- Quad digital switch chip
- Used to clear the output of the OP-Amp integrator
- Adafruit HUZZAH32 – ESP32 Feather Board
- Microcontroller to power the project
- Has onboard battery charging
- Onboard bluetooth
- Open Source Hardware Ecosystem[9]
- Adafruit 2.9" Tri-Color eInk / ePaper Display FeatherWing - Red Black White
- Display to interact with the users
- Inbuilt SD card reader
- Small buttons for user input
- Battery
- RTC
- Case
- Test Strip Connector
Second Concept Design[edit | edit source]
In our second design iteration, the blood glucose was to be measured colorimetrically. The blood would be placed on a test strip produced by printing chemicals onto filter paper using a commercial inkjet printer. These chemicals, glucose oxidase (GOX), horseradish peroxidase (HRP), and 2,2'-azino-bis(3-ethylbenzothiazoline-6-sulfonic acid) (ABTS) react with the glucose in the blood and causes a colorimetric change. This change in color, represented primarily in the 405 nm wavelength, is determined by passing a 405 nm light through the strip whose intensity is then measured by a photodiode. Using Beer-Lambert’s law this change in intensity relative to a control can be used to relate the known glucose concentration to the intensity of the light passing through the strip.
Mechanical Design[edit | edit source]
The only mechanical design of the glucose meter was to design a 3D printed top for the ink cartridge container. When taking the top off in order to do water testing in the printer, the top broke and a new top was needed to be CAD. When it came to using the printer to spread the chemicals, the plan was to tape a filter paper to the printer paper and then print the chemicals in that spot over one another. However, the printer could not print any water-like substance as it is not the same consistency as ink, and other means were needed to be taken, spoken more in the testing and validation section.
Electrical Design[edit | edit source]
The electrical component of this design was very similar to our earlier design, in both cases a small current measurement was to be amplified by an OpAmp and measured by the feather. To measure the amount of 405 nm light absorbed by the strip we used a S-5420A-P6T2S photodiode from ABLIC coupled with a 405 nm LED. The photodiode has two current outputs that need to be converted to voltage and subtracted from each other. These functions were accomplished with a MCP6004 OpAmp and the output was fed into an ESP32 Feather from Adafruit. Images of the circuit diagram and PCB layout are included below.


Design Analysis & What Happened[edit | edit source]
Unfortunately, there was not enough time to conduct a full analysis of the circuit due to time. There were delays in the project that were unforeseen. Through configuring this circuit by hand with little prior knowledge, a lot has been learned about this set up and project. We are hoping with this, someone can take measurements in the future with the blood tests and determine the glucose levels.
Testing & Validation[edit | edit source]
Tests were first conducted to determine the effective shelf life and optimum storage modality of the animal blood obtained from a local veterinary clinic. Using a Contour Next Link a baseline reading of the blood glucose concentration was taken. We then stored the blood in either a fridge, a freezer, or at room temperature and retook the measurements.
| Test Tube | 23 March Reading | 24 March Reading | 25 March Reading |
|---|---|---|---|
| 01 - freezer | 100 mg/dL | 97 mg/dL | 109 mg/dL |
| 02 - fridge | 109 mg/dL | 104 mg/dL | - |
| 03 - fridge | - | 84 mg/dL | 126 gm/dL |
| 04 - room temp | 40 mg/dL | not spreading to read | not spreading to read |


For the frozen blood, following the first freeze thaw cycle the glucose reading increased, but then stabilized for subsequent readings. This is most likely due to the lysing of the erythrocytes releasing glucose into the whole blood. While this means that the measurement does not accurately represent the original glucose level of the blood it will still work for the purposes of testing the meter by using the reading following the first freeze thaw cycle as the baseline rather than the original reading. This allows for a much longer shelf life when compared to room or fridge temperature storage.
Testing was also performed to choose a pore size for the filter paper on which the tests were to be conducted. 1mL of blood was placed on the filter paper and allowed to spread. For our purposes the blood would need to spread throughout the entire testing strip so the filter paper that allowed for the most spread was picked. The filter paper that was chosen was the 4 Qualitative at 90mm an 20-25 micrometers.


For the production of the test strips, due to issues with the printer, they were produced by hand. A 2cm by 3cm grid was outlined on top of the filter paper using clear tape. The chemicals were reconstituted in water with the following concentrations, GOX = 0.29 mg/dL, HRP = 1.45 mg/dL, and ABTS = 0.004 mg/dL. Using a Q-tip, ABTS was painted on all the regions, followed by HRP. GOX was then painted onto half of the regions. Single drops of blood were then placed in each of the sections.


Code Files[edit | edit source]
Current versions of the code can be found at:
https://github.com/ebmichel/OSHE-Blood-Glucose-Meter
Acknowledgements[edit | edit source]
Copper County Veterinary Clinic for supplying the animal blood used in testing.
References[edit | edit source]
- ↑ 1.0 1.1 https://www.fda.gov/media/87721/download
- ↑ https://www.ncbi.nlm.nih.gov/pmc/articles/PMC4667310/
- ↑ https://www.cdc.gov/diabetes/data/statistics-report/index.html
- ↑ 4.0 4.1 https://www.ncbi.nlm.nih.gov/pmc/articles/PMC2864180/
- ↑ https://www.touchendocrinology.com/diabetes/journal-articles/cost-comparison-of-flash-continuous-glucose-monitoring-with-self-monitoring-of-blood-glucose-in-adults-with-type-1-or-type-2-diabetes-using-intensive-insulin-from-a-us-private-payer-perspectiv/
- ↑ 6.0 6.1 6.2 https://hackaday.io/project/11719-open-source-arduino-blood-glucose-meter-shield/log/39412-basic-glucose-meter-schematic
- ↑ https://www.ncbi.nlm.nih.gov/pmc/articles/PMC6263380/
- ↑ https://ieeexplore.ieee.org/document/9524612/
- ↑ https://learn.adafruit.com/adafruit-feather/feather-specification